大数据可视化Google Chart实现
本程序调用Weka API及libsvm工具包,对基金数据库进行数据预处理,然后将处理好的数据通过Chart.js 框架来实现数据的可视化,接下来要说明实现流程。
完整版源码下载
数据读取
连接数据库
Class.forName("com.mysql.jdbc.Driver").newInstance();
    String url = "jdbc:mysql://localhost:3306/test";
    String user = "root";
    String password = "";
    Connection conn = DriverManager.getConnection(url, user, password);
    Statement st = conn.createStatement();
查询数据
查询在2015年10月12日(周一)这一天的所有股票交易记录
ResultSet rs = st.executeQuery("SELECT * FROM history where Time='2015-10-12,1'");数据处理
这部分使用weka API中的j48算法和svm算法来对数据进行处理
Weka连接数据库
查询涨幅不小于0.1的数据
 InstanceQuery query = new InstanceQuery();
    query.setDatabaseURL("jdbc:mysql://localhost:3306/test");
    query.setUsername("root");
    query.setPassword("");
    query.setQuery("SELECT `Open`,Highest,Lowest,`Close`, `Change`,Increase,Amplitude,HandsAll,Money from history where Increase>=0.1;");
数据预处理
据预处理包括数据的缺失值处理、标准化、规范化和离散化处理。
- 数据的缺失值处理
weka.filters.unsupervised.attribute.ReplaceMissingValues。 对于数值属性,用平均值代替缺失值,对于nominal属性,用它的mode(出现最多的值)来代替缺失值。
- 标准化
类(standardize)weka.filters.unsupervised.attribute.Standardize。标准化给定数据集中所有数值属性的值到一个0均值和单位方差的正态分布。
- 规范化(Nomalize)
类weka.filters.unsupervised.attribute.Normalize。规范化给定数据集 中的所有数值属性值,类属性除外。结果值默认在区间[0,1],但是利用缩放和平移参数,我们能将数值属性值规范到任何区间。如:但 scale=2.0,translation=-1.0时,你能将属性值规范到区间[-1,+1]。
- 离散化(discretize)
weka.filters.supervised.attribute.Discretize
weka.filters.unsupervised.attribute.Discretize。
分别进行监督和无监督的数值属性的离散化,用来离散数 据集中的一些数值属性到分类属性。
数据预处理是所有数据挖掘算法的前提基础。拿到一个数据源,不太可能直接用于数据挖掘算法。
为了既不破坏业务数据的数据结构,又能为数据挖掘算法所使用,就需要进行数据预处理的过程,将数据源进行一定的处理,得到数据挖掘算法的输入数据。
非监督过滤
 1.Add为数据库添加一个新的属性,新的属性将会包含所有缺失值。可选参数:attributeIndex:属性位置,从1开始算,last是最后一个,first是第一个attributeName:属性名称attributeType:属性类型,一般是4选1dateFormat:数据格式,参考ISO-8601nominalLabels:名义标签,多个值用逗号隔开


3.AddID字面意思,添加一个ID

4.AddNoise只对名义属性有效,依照一定比例修改值。

5.Center将数值化属性的平均化为0。

6.ChangeDateFormat修改数据格式

7.Copy复制制定属性并命名为Copy Of XX

8.Discretize简单划分的离散化处理。参数:attributeIndices:属性范围,如1-5,first-lastbins:桶的数量

9.FirstOrder第n个值用n+1项值和n项值的差替换

10.MathExpression功能和AddExpression类似,不过支持的运算更多,特别是MAX和MIN的支持特别有用。所有支持运算符如下:+, -, *, /, pow, log,abs, cos, exp, sqrt, tan, sin, ceil, floor, rint, (, ),A,MEAN, MAX, MIN, SD, COUNT, SUM, SUMSQUARED,
ifelse11.Reorder重新排列属性,输入2-last

11.可以让第一项排到最后,如果输入1,3,5的话…其他项就没有了

12.Standardize这个和Center功能大致相同,多了一个标准化单位变异数

13.StringToNominal将String型转化为Nominal型14.SwapValues
然后是weka.filters.unsupervised.instance包下的
1.NonSparseToSparse

将所有输入转为稀疏格式
2.Normalize

规范化整个实例集
3.RemoveFolds

交叉验证,不支持分层,如果需要的话使用监督学习中的方法
4.RemoveRange

移除制定范围的实例,化为NaN
5.Resample

随机抽样,从现有样本产生新的小样本
6.SubsetByExpression

根据规则进行过滤,支持逻辑运算,向上取值,取绝对值等等
代码实现如下
    Instances data = query.retrieveInstances();
    data.setClassIndex(0); // 设置分类属性所在行号(第一行为0号),instancesTest.numAttributes()可以取得属性总数
    data.setClassIndex(0);
    Discretize discretize = new Discretize();
    String[] options = new String[6];
    options[0] = "-B";
    options[1] = "8";
    options[2] = "-M";
    options[3] = "-1.0";
    options[4] = "-R";
    options[5] = "2-last";
    discretize.setOptions(options);
    discretize.setInputFormat(data);
    Instances newInstances1 = Filter.useFilter(data, discretize);
存入到本地
DataSink.write("C://j48.arff", data);此时在C盘根目录下会出现一个j48.arff文件
对预处理后的数据分类
以J48算法为例,代码如下
ile inputFile = new File("C://j48.arff");//训练语料文件

    ArffLoader atf = new ArffLoader();

    atf.setFile(inputFile);

    Instances instancesTrain = atf.getDataSet(); // 读入测试文件

    instancesTrain.setClassIndex(0); // 设置分类属性所在行号(第一行为0号),instancesTest.numAttributes()可以取得属性总数

    double sum = instancesTrain.numInstances(), // 测试语料实例数

    right = 0.0f;

    data.setClassIndex(0);
    Classifier m_classifier = new J48();
    m_classifier.buildClassifier(data); // 训练

    for (int i = 0; i < sum; i++)// 测试分类结果

    {
      if (m_classifier.classifyInstance(instancesTrain.instance(i)) == instancesTrain
          .instance(i).classValue())// 如果预测值和答案值相等(测试语料中的分类列提供的须为正确答案,结果才有意义)
      {

        right++;// 正确值加1
      }

    }
    out.println("J48:" + (right / sum));
数据显示
Chart.js框架,版本1.0.2,一个简单、轻量级的绘图框架,基于HTML5 canvas。这个框架能很多种图,折线图、柱状图、玫瑰图等。
引入Chart.js文件
Char.js下载
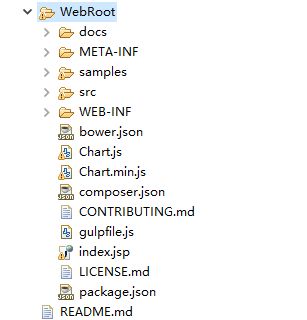
我们将下载好的文件整个拷贝到WebRoot根目录下,效果如图

首先我们需要在页面中引入Chart.js文件。此工具库在全局命名空间中定义了Chart变量。
<script src="./Chart.js"></script>创建图表
为了创建图表,我们要实例化一个Chart对象。为了完成前面的步骤,首先需要需要传入一个绘制图表的2d context。以下是案例。
- html代码
<div id="left" style="width:40%">
        <canvas id="canvas" height="512" width="512"></canvas>

</div>- js代码
window.myBar = new Chart(document.getElementById("canvab")
                    .getContext("2d")).Bar(barChartData, {
                responsive : true
            });
我们还可以用jQuery获取canvas的context。首先从jQuery集合中获取我们需要的DOM节点,然后在这个DOM节点上调用 getContext(“2d”) 方法。
//Get context with jQuery - using jQuery's .get() method.
var ctx = $("#myChart").get(0).getContext("2d");
//This will get the first returned node in the jQuery collection.
var myNewChart = new Chart(ctx);
当我们完成了在指定的canvas上实例化Chart对象之后,Chart.js会自动针对retina屏幕做缩放。
Chart对象设置完成后,我们就可以继续创建Chart.js中提供的具体类型的图表了。下面这个案例中,我们将展示如何绘制一幅极地区域图(Polar area chart)。
new Chart(ctx).PolarArea(data,options);自定义表格
定义表格,方便将jdbc读取的数据传送到javaScript中。为每一个td设定一个id,通rs.getString()方法读取从数据库中获取的数据
<tr>
            <td width="100" id="Index"><%=rs.getString("Index")%></td>
            <td width="100" id="Time"><%=rs.getString("Time")%></td>
            <td width="100" id="Open"><%=rs.getString("Open")%></td>
            <td width="100" id="Highest"><%=rs.getString("Highest")%></td>
            <td width="100" id="Lowest"><%=rs.getString("Lowest")%></td>
            <td width="100" id="Close"><%=rs.getString("Close")%></td>
            <td width="100" id="Change"><%=rs.getString("Change")%></td>
            <td width="100" id="Increase"><%=rs.getString("Increase")%></td>
            <td width="100" id="Amplitude"><%=rs.getString("Amplitude")%></td>
            <td width="100" id="HandsAll"><%=rs.getString("HandsAll")%></td>
            <td width="100" id="Money"><%=rs.getString("Money")%></td>

            <td width="100" id="J48 classification precision" value="J48"><%=right / sum%></td>

        </tr>
数据结构
通过document.getElementById().innerHTML方法将td标签 中的数据传入到data:中
var barChartData =
{
    labels : ["Open", "Highest", "Lowest", "Close", "Change",
        "Increase", "Amplitude", "HandsAll", "Money", "Accuracy"],
    datasets : [
        {
            fillColor : "rgba(220,220,220,0.5)",
            strokeColor : "rgba(220,220,220,0.8)",
            highlightFill : "rgba(220,220,220,0.75)",
            highlightStroke : "rgba(220,220,220,1)",
            data : [
                document.getElementById("Open").innerHTML,
                document.getElementById("Highest").innerHTML,
                document.getElementById("Lowest").innerHTML,
                document.getElementById("Close").innerHTML,
                document.getElementById("Change").innerHTML,
                document.getElementById("Increase").innerHTML,
                document.getElementById("Amplitude").innerHTML,
                document.getElementById("HandsAll").innerHTML,
                document.getElementById("Money").innerHTML,
                document
                .getElementById("J48 classification precision").innerHTML, ]
        },
        {
            fillColor : "rgba(151,187,205,0.5)",
            strokeColor : "rgba(151,187,205,0.8)",
            highlightFill : "rgba(151,187,205,0.75)",
            highlightStroke : "rgba(151,187,205,1)",
            data : [
                document.getElementById("Opens").innerHTML,
                document.getElementById("Highests").innerHTML,
                document.getElementById("Lowests").innerHTML,
                document.getElementById("Closes").innerHTML,
                document.getElementById("Changes").innerHTML,
                document.getElementById("Increases").innerHTML,
                document.getElementById("Amplitudes").innerHTML,
                document.getElementById("HandsAlls").innerHTML,
                document.getElementById("Moneys").innerHTML,
                document
                .getElementById("SVM classification precision").innerHTML, ]
        }
    ]

}
预测数据获取
package cn.zju.edu.test;

import java.io.File;
import java.io.FileWriter;
import java.io.PrintWriter;
import java.sql.Connection;
import java.sql.DriverManager;
import java.sql.ResultSet;
import java.sql.SQLException;
import java.sql.Statement;
import java.util.ArrayList;
import java.util.Iterator;

/*import weka.classifiers.functions.LibSVM;*/

public class DataUtil {
public DataUtil() throws Exception{
        Class.forName("com.mysql.jdbc.Driver").newInstance();
        String url = "jdbc:mysql://localhost:3306/test";
        String user = "root";
        String password = "";
        Connection conn = DriverManager.getConnection(url, user, password);
        Statement st = conn.createStatement();
        Statement st1 = conn.createStatement();
        ResultSet rs = st
                .executeQuery("SELECT Increase FROM history where Time='2015-10-12,1'");
        ResultSet rss = st1
                .executeQuery("SELECT Increase FROM history where Time='2015-10-13,2'");
        while (rs.next()&&rss.next()) {
            String str = rs.getString("Increase");
            String str2=rss.getString("Increase");
            newFile("./train.txt", str+","+str);//保存2015年10月12日的涨幅情况用于训练
            newFile("./test.txt", str2+","+str2);//保存2015年10月13日的涨幅情况用于测试
        }


}

    public static void newFile(String filePathAndName, String fileContent) {
        try {

            File myFilePath = new File(filePathAndName.toString());
            if (!myFilePath.exists()) { // 如果该文件不存在,则创建
                myFilePath.createNewFile();
            }
            // FileWriter(myFilePath, true); 实现不覆盖追加到文件里

            // FileWriter(myFilePath); 覆盖掉原来的内容

            FileWriter resultFile = new FileWriter(myFilePath, true);

            PrintWriter myFile = new PrintWriter(resultFile);

            // 给文件里面写内容,原来的会覆盖掉
            myFile.println(fileContent);

            resultFile.close();

        } catch (Exception e) {
            e.printStackTrace();

        }

    }

}
SVR预测类
public class Predict {
    public static void main(String[] args) throws Exception {
        new DataUtil();//获取测试数据和训练数据
        List<Double> label = new ArrayList<Double>();
        List<svm_node[]> nodeSet = new ArrayList<svm_node[]>();
        getData(nodeSet, label, "./train.txt");

        int dataRange = nodeSet.get(0).length;
        svm_node[][] datas = new svm_node[nodeSet.size()][dataRange]; // 训练集的向量表
        for (int i = 0; i < datas.length; i++) {
            for (int j = 0; j < dataRange; j++) {
                datas[i][j] = nodeSet.get(i)[j];
            }
        }
        double[] lables = new double[label.size()]; // a,b 对应的lable
        for (int i = 0; i < lables.length; i++) {
            lables[i] = label.get(i);
        }
        // 定义svm_problem对象
        svm_problem problem = new svm_problem();
        problem.l = nodeSet.size(); // 向量个数
        problem.x = datas; // 训练集向量表
        problem.y = lables; // 对应的lable数组
        // 定义svm_parameter对象
        svm_parameter param = new svm_parameter();
        param.svm_type = svm_parameter.EPSILON_SVR;
        param.kernel_type = svm_parameter.LINEAR;
        param.cache_size = 100;
        param.eps = 0.00001;
        param.C = 1.9;
        // 训练SVM分类模型
        System.out.println(svm.svm_check_parameter(problem, param));
        // 如果参数没有问题,则svm.svm_check_parameter()函数返回null,否则返回error描述。
        svm_model model = svm.svm_train(problem, param);
        // svm.svm_train()训练出SVM分类模型
        // 获取测试数据
        List<Double> testlabel = new ArrayList<Double>();
        List<svm_node[]> testnodeSet = new ArrayList<svm_node[]>();
        getData(testnodeSet, testlabel, "./test.txt");
        svm_node[][] testdatas = new svm_node[testnodeSet.size()][dataRange]; // 训练集的向量表
        for (int i = 0; i < testdatas.length; i++) {
            for (int j = 0; j < dataRange; j++) {
                testdatas[i][j] = testnodeSet.get(i)[j];
            }
        }
        double[] testlables = new double[testlabel.size()]; // a,b 对应的lable
        for (int i = 0; i < testlables.length; i++) {
            testlables[i] = testlabel.get(i);
        }
        // 预测测试数据的lable
        double err = 0.0;
        for (int i = 0; i < testdatas.length; i++) {
            double truevalue = testlables[i];
            System.out.print("真实值:"+truevalue + " ");
            double predictValue = svm.svm_predict(model, testdatas[i]);
            System.out.println("预测值:"+predictValue);
            err += Math.abs(predictValue - truevalue);
            Class.forName("com.mysql.jdbc.Driver").newInstance();
            String url = "jdbc:mysql://localhost:3306/test";
            String user = "root";
            String password = "";
            Connection conn = DriverManager.getConnection(url, user, password);
            Statement st = conn.createStatement();
            st.executeUpdate("insert into predictresult(truevalue,predictvalue) values('"+truevalue+"'"+","+"'"+predictValue+"');");
            conn.close();
            DataUtil.newFile("./result.txt", "真实值:"+truevalue + " "+"预测值:"+predictValue+" "+"err=" + err / datas.length);
        }
        /*System.out.println("err=" + err / datas.length);*/

    }

    public static void getData(List<svm_node[]> nodeSet, List<Double> label, String filename) {
        try {
            FileReader fr = new FileReader(new File(filename));
            BufferedReader br = new BufferedReader(fr);
            String line = null;
            while ((line = br.readLine()) != null) {
                String[] datas = line.split(",");
                svm_node[] vector = new svm_node[datas.length - 1];
                for (int i = 0; i < datas.length - 1; i++) {
                    svm_node node = new svm_node();
                    node.index = i + 1;
                    node.value = Double.parseDouble(datas[i]);
                    vector[i] = node;
                }
                nodeSet.add(vector);
                double lablevalue = Double.parseDouble(datas[datas.length - 1]);
                label.add(lablevalue);
            }
        } catch (Exception e) {
            e.printStackTrace();
        }
    }
}
柱状图标参数
Bar.defaults = {

    //Boolean - If we show the scale above the chart data scaleOverlay : false, //Boolean - If we want to override with a hard coded scale scaleOverride : false, //** Required if scaleOverride is true ** //Number - The number of steps in a hard coded scale scaleSteps : null, //Number - The value jump in the hard coded scale scaleStepWidth : null, //Number - The scale starting value scaleStartValue : null, //String - Colour of the scale line scaleLineColor : "rgba(0,0,0,.1)", //Number - Pixel width of the scale line scaleLineWidth : 1, //Boolean - Whether to show labels on the scale scaleShowLabels : false, //Interpolated JS string - can access value scaleLabel : "<%=value%>", //String - Scale label font declaration for the scale label scaleFontFamily : "'Arial'", //Number - Scale label font size in pixels scaleFontSize : 12, //String - Scale label font weight style scaleFontStyle : "normal", //String - Scale label font colour scaleFontColor : "#666", ///Boolean - Whether grid lines are shown across the chart scaleShowGridLines : true, //String - Colour of the grid lines scaleGridLineColor : "rgba(0,0,0,.05)", //Number - Width of the grid lines scaleGridLineWidth : 1, //Boolean - If there is a stroke on each bar barShowStroke : true, //Number - Pixel width of the bar stroke barStrokeWidth : 2, //Number - Spacing between each of the X value sets barValueSpacing : 5, //Number - Spacing between data sets within X values barDatasetSpacing : 1, //Boolean - Whether to animate the chart animation : true, //Number - Number of animation steps animationSteps : 60, //String - Animation easing effect animationEasing : "easeOutQuart", //Function - Fires when the animation is complete onAnimationComplete : null }
蛛网图标参数
Radar.defaults = {

    //Boolean - If we show the scale above the chart data scaleOverlay : false, //Boolean - If we want to override with a hard coded scale scaleOverride : false, //** Required if scaleOverride is true ** //Number - The number of steps in a hard coded scale scaleSteps : null, //Number - The value jump in the hard coded scale scaleStepWidth : null, //Number - The centre starting value scaleStartValue : null, //Boolean - Whether to show lines for each scale point scaleShowLine : true, //String - Colour of the scale line scaleLineColor : "rgba(0,0,0,.1)", //Number - Pixel width of the scale line scaleLineWidth : 1, //Boolean - Whether to show labels on the scale scaleShowLabels : false, //Interpolated JS string - can access value scaleLabel : "<%=value%>", //String - Scale label font declaration for the scale label scaleFontFamily : "'Arial'", //Number - Scale label font size in pixels scaleFontSize : 12, //String - Scale label font weight style scaleFontStyle : "normal", //String - Scale label font colour scaleFontColor : "#666", //Boolean - Show a backdrop to the scale label scaleShowLabelBackdrop : true, //String - The colour of the label backdrop scaleBackdropColor : "rgba(255,255,255,0.75)", //Number - The backdrop padding above & below the label in pixels scaleBackdropPaddingY : 2, //Number - The backdrop padding to the side of the label in pixels scaleBackdropPaddingX : 2, //Boolean - Whether we show the angle lines out of the radar angleShowLineOut : true, //String - Colour of the angle line angleLineColor : "rgba(0,0,0,.1)", //Number - Pixel width of the angle line angleLineWidth : 1, //String - Point label font declaration pointLabelFontFamily : "'Arial'", //String - Point label font weight pointLabelFontStyle : "normal", //Number - Point label font size in pixels pointLabelFontSize : 12, //String - Point label font colour pointLabelFontColor : "#666", //Boolean - Whether to show a dot for each point pointDot : true, //Number - Radius of each point dot in pixels pointDotRadius : 3, //Number - Pixel width of point dot stroke pointDotStrokeWidth : 1, //Boolean - Whether to show a stroke for datasets datasetStroke : true, //Number - Pixel width of dataset stroke datasetStrokeWidth : 2, //Boolean - Whether to fill the dataset with a colour datasetFill : true, //Boolean - Whether to animate the chart animation : true, //Number - Number of animation steps animationSteps : 60, //String - Animation easing effect animationEasing : "easeOutQuart", //Function - Fires when the animation is complete onAnimationComplete : null }
运行
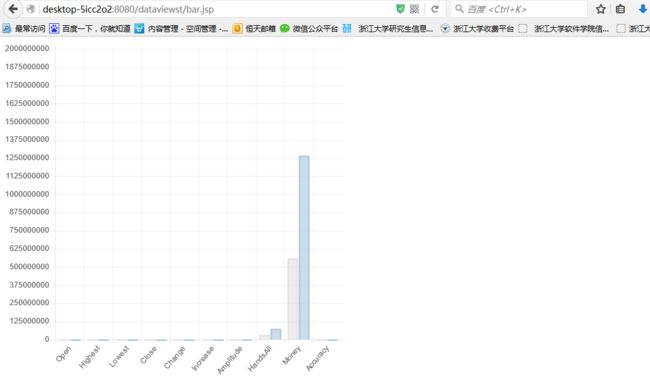
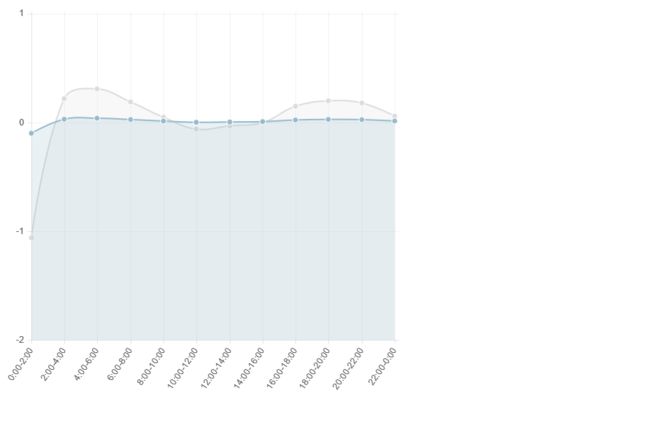
右键单击Run as-> MyEclipse Server Application,启动后在浏览器里输入:localhost:8080/dataviewt/index.jsp可查看不同可视化效果 主要比较股票在2015-10-12,1和2015-10-13,2这两个不同时间段的行情指数


