利用R语言进行线性/非线性回归拟合实例(1)
利用R语言进行线性/非线性回归拟合实例(1)
1、 生成一组数据
vector<float>xxvec;
vector<float>yyvec;
ofstreamfout("data2.txt");
for (int i =1;i<200;i++)
{
float x =i*0.8;
float randdnum= rand()%10 * 10;
floatrandomflag = (rand()%10)%2==0?(1):(-1);
float y = 3 *x*x + 2*x + 5 + randomflag*randdnum;
fout<<x<<" "<<y<<endl;
xxvec.push_back(x);
yyvec.push_back(y);
}
fout.close();
将生成的数据存为txt文件,命名为“data1”
2、线性拟合
#-------------------------------------------------------------#载入数据
> fire <- read.table('D:/data.txt',header = TRUE)
#-------------------------------------------------------------#回归分析
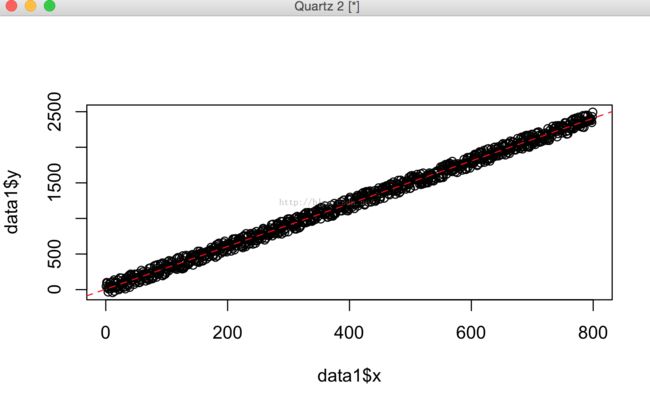
> plot(fire$y ~ fire$x)
> fire.reg <- lm(fire$y ~ fire$x,data = fire) #回归拟合
> data1.reg
Call:
lm(formula = data1$y ~ data1$x, data = data1)
Coefficients:
(Intercept) data1$x
6.202 3.003
>summary(data1.reg) #回归分析表
Call:
lm(formula = data1$y ~ data1$x, data = data1)
Residuals:
Min 1Q Median 3Q Max
-93.345 -42.929 -1.948 46.717 88.793
Coefficients:
Estimate Std. Error tvalue Pr(>|t|)
(Intercept) 6.202084 3.352055 1.85 0.0646 .
data1$x 3.002826 0.007259 413.66 <2e-16 ***
标红数字即为线性回归系数,由于生成数据时加了一个随机数,所以拟合出来的直线为:
y=3.002826 x+6.202084
---
Signif. codes: 0 ‘***’ 0.001 ‘**’0.01 ‘*’ 0.05 ‘.’ 0.1 ‘ ’ 1
Residual standard error: 52.93 on 997 degrees of freedom
Multiple R-squared: 0.9942, Adjusted R-squared: 0.9942
F-statistic: 1.711e+05 on 1 and 997 DF, p-value: < 2.2e-16
>anova(data1.reg) #方差分析表
Analysis of Variance Table
Response: data1$y
Df Sum Sq Mean Sq F value Pr(>F)
data1$x 1479462873 479462873 171112 < 2.2e-16***
Residuals 997 2793641 2802
Signif. codes: 0‘***’ 0.001 ‘**’ 0.01 ‘*’ 0.05 ‘.’ 0.1 ‘ ’ 1
>abline(data1.reg, col = 2, lty = 2) #拟合直线
