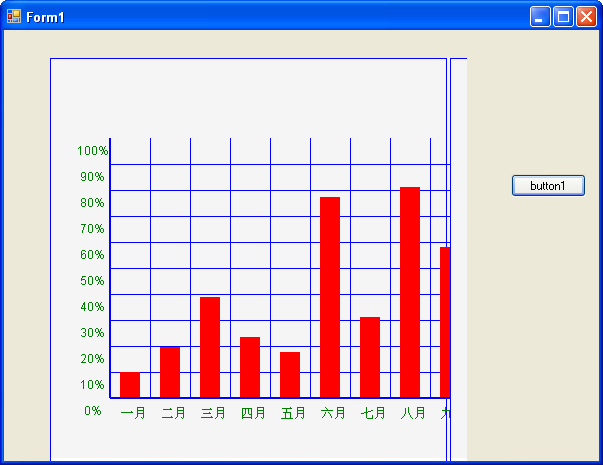
C#利用Graphics来绘图
之前都是用的一个Chart控件来显示走势图,现在这种方法是使用Graphics来绘制。
private void button1_Click(object sender, EventArgs e)
{
int height = 400, width = 600;
System.Drawing.Bitmap image = new System.Drawing.Bitmap(height, width);
Graphics g = Graphics.FromImage(image);//创建一个对象
Font font = new System.Drawing.Font("Arial", 9, FontStyle.Regular);
g.Clear(Color.White);
System.Drawing.Drawing2D.LinearGradientBrush brush = new System.Drawing.Drawing2D.LinearGradientBrush(new Rectangle(0, 0, image.Width, image.Height), Color.Blue, Color.Blue, 1.2f, true);
g.FillRectangle(Brushes.WhiteSmoke, 0, 0, width, height);
Brush brush1 = new SolidBrush(Color.Blue);
g.DrawRectangle(new Pen(Color.Blue), 0, 0, image.Width - 4, image.Height - 4);
Pen mypen = new Pen(brush, 1);
int x = 100;
for (int i = 0; i < 11; i++)
{
g.DrawLine(mypen, x, 80, x, 340);
x = x + 40;
}
Pen mypen1 = new Pen(Color.Blue, 2);
g.DrawLine(mypen1, x - 480, 80, x - 480, 340);
int y = 106;
for (int i = 0; i < 9; i++)
{
g.DrawLine(mypen, 60, y, 540, y);
y = y + 26;
}
g.DrawLine(mypen1, 60, y, 540, y);
//x
String[] month = {" 一月", " 二月", " 三月", " 四月", " 五月", " 六月", " 七月",
" 八月", " 九月", " 十月", "十一月", "十二月"};
x = 62;
for (int i = 0; i < 12; i++)
{
g.DrawString(month[i].ToString(), font, Brushes.Green, x, 348);
x = x + 40;
}
//y
String[] m = {"100%", " 90%", " 80%", " 70%", " 60%", " 50%", " 40%", " 30%",
" 20%", " 10%", " 0%"};
y = 85;
for (int i = 0; i < 11; i++)
{
g.DrawString(m[i].ToString(), font, Brushes.Green, 25, y);
y = y + 26;
}
//实际的数据可以从数据库读取出来保存在一个数组里面即可。
int[] Count = new int[12];
Count[0] = 50;
Count[1] = 100;
Count[2] = 200;
Count[3] = 120;
Count[4] = 90;
Count[5] = 400;
Count[6] = 160;
Count[7] = 420;
Count[8] = 300;
Count[9] = 280;
Count[10] = 350;
Count[11] = 15;
x = 70;
for (int i = 0; i < 12; i++)
{
SolidBrush mybrush = new SolidBrush(Color.Red);
g.FillRectangle(mybrush, x, 339 - Count[i] * 5 / 10, 20, Count[i] * 5 / 10);
x = x + 40;
}
//将图片设置为Panel的背景颜色,然后呈现出来。
this.panel1.BackgroundImage = image;
}
