R语言学习笔记——用ggplot2作图
数据:ggplot2中的diamonds数据集,利用随机抽样取1000个样本,代码如下:
> library(ggplot2)
> data("diamonds")
> head(diamonds)
> set.seed(1234)
> small <- diamonds[sample(nrow(diamonds),1000), ]
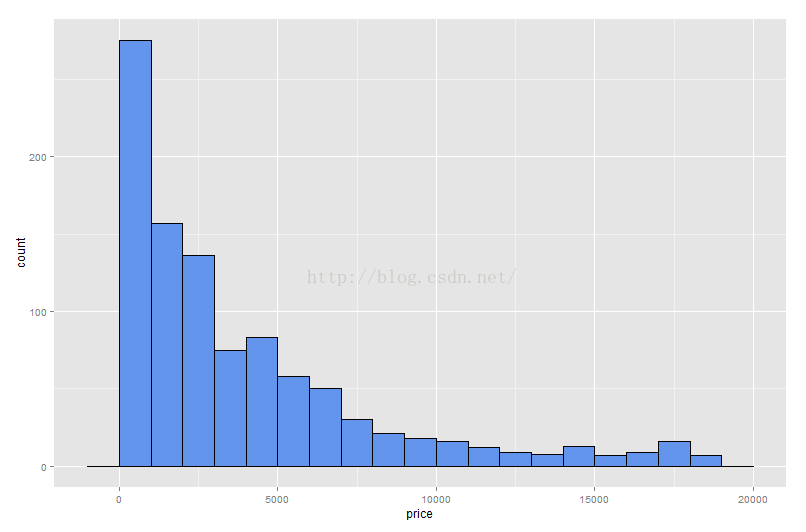
直方图
> ggplot(small)+geom_histogram(aes(x=price),fill="cornflowerblue",colour="black",binwidth= 1000)
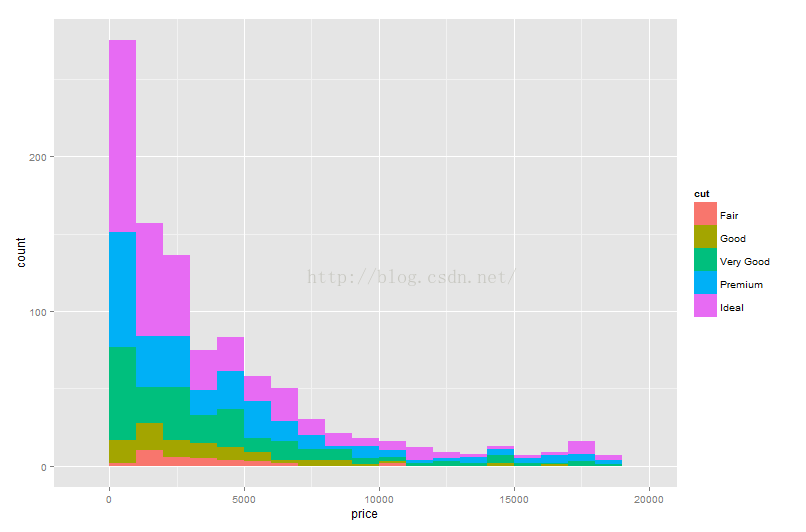
堆叠直方图
用数据中的“cut”列(分为5个档次,用来区分钻石的质量)来作堆叠直方图如下:
>ggplot(small)+geom_histogram(aes(x=price),fill="cornflowerblue",colour="black",binwidth= 1000)
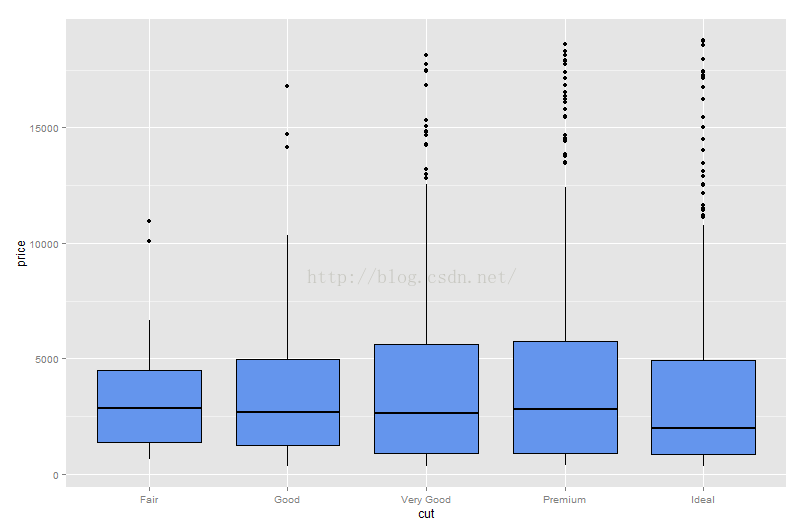
箱线图
> ggplot(small)+geom_boxplot(aes(x=cut,y=price),fill="cornflowerblue",colour="black")
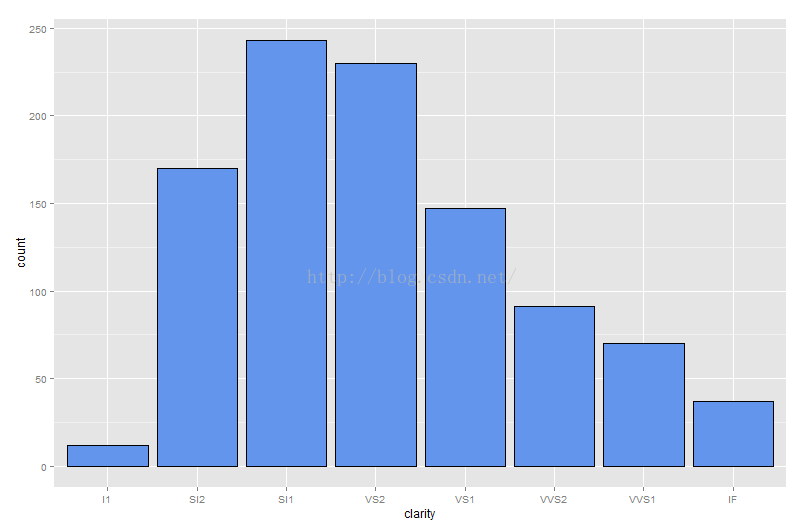
柱状图
>ggplot(small)+geom_bar(aes(x=clarity),fill="cornflowerblue",colour="black")
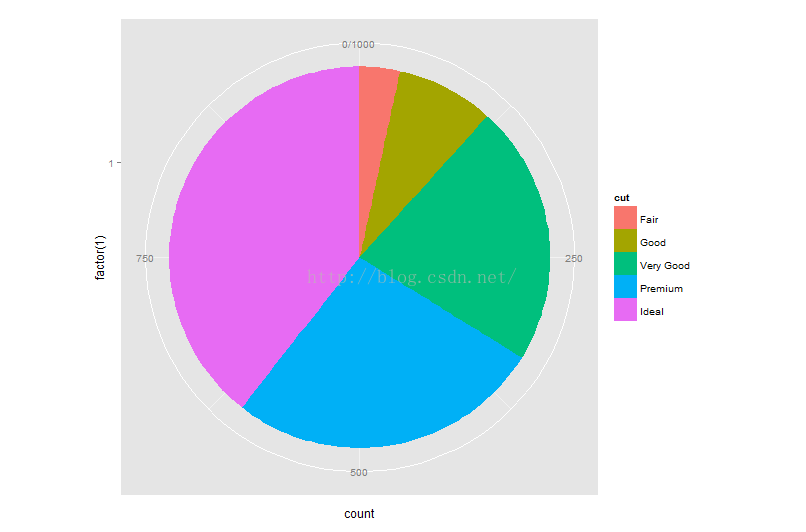
饼图
>ggplot(small)+geom_bar(aes(x=factor(1),fill=cut),width=1)+coord_polar(theta="y")