R语言︱画图
笔者寄语:不论画啥,你先plot准没错。
| plot | 二维坐标绘图 |
| dotchart | 点图 |
| barplot | 条形图 |
| hist | 直方图 |
| pie | 饼图 |
| points | 添加点 |
| lines | 添加线 |
| text | 添加文字 |
| title | 添加标题 |
| boxplot | 箱线图 |
1、plot函数
##画图
plot(x~y,xlab="",ylab="",main="",xlim=c(0,45),ylim=c(0,45),pch=18,col=2,cex=5)
#xlab/ylab,xy标题
#main,主标题
#xlim,ylim,xy线段范围
#pch,点的类型(圆形、棱形等)
#col,线条的颜色
#cex,点的大小
2、分块展示
#预先在数据框中分块,2*2分块
par(mfrow=c(2,2),mar=c(3,3,2,1))
par(del)                           #画好需要关闭
3、箱型图
#箱型图
boxplot(x~y,data=iris)  #依据y分类,求得x的箱型图
4、条形图
#条形图
barplot(x,beside=T,col=rainbow) #beside=T代表邻接条形图,F代表堆砌
5、直方图
#直方图
hist(iris$Petal.Width,freg=F)  #freg=F,概率=频率/组距(离散概率密度特有的公式),当组距为1时,概率等于频率
hist(iris$Petal.Width,freg=T)  #freg=T,频率
lines(density(iris$Petal.Width),col=4) #概率密度
lines(x,dnorm(x,mean(iris$Petal.Width),sd(iris$Petal.Width)),col=red)#正态密度曲线
6、QQ图
#QQ图——检验正态性
qqnorm(x)
qqline(x)
shapiro.test(x)  #正态性检验
7、带形图
#带形图
strpchart(y~x,vert=T,pch=1,method="jiter",jit=0.05)
point(x,y,pch=16,cxe=1.5)
arrows(x,y,x,y+se)
arrows(x,y,x,y-se)
8、克利夫兰图
#克利夫兰图
dotchart
9、组合图
#组合图
pairs(iris[,2:4])
plot(iris[,2:4])  #与上面一样
10、雷达图
##雷达图
stars(x,full=F,draw.segments = T,key.loc =c(5,0.5) , mar =c(2,0,0,0) )
#full=F,代表半圆
#segments代表一段一段画
#注释图标位置
#图边距
11、直方图+帕累托图结合
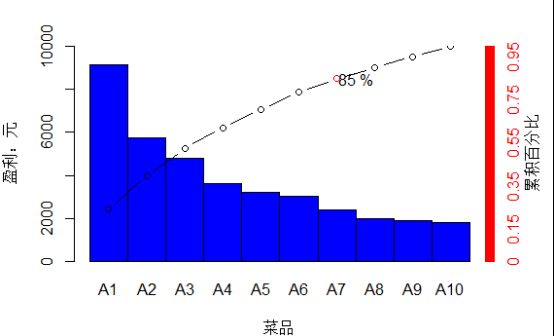
帕累托图可以实现,同类元素的贡献率比较。
<span style="font-family: 'Microsoft YaHei'; font-size: 18px;">dishdata=read.csv(file="./data/catering_dish_profit.csv",header=TRUE)
barplot(dishdata[,3],col="blue1",names.arg=dishdata[,2],width=1,space=0,ylim=c(0,10000),xlab="菜品",ylab="盈利:元")
accratio=dishdata[,3]
for ( i in 1:length(accratio)){
  accratio[i]=sum(dishdata[1:i,3])/sum(dishdata[,3])
}</span><span style="font-family:Microsoft YaHei;font-size:18px;">
</span>
先做一个直方图,然后把数据,以点的形式加入直方图中。
<span style="font-family:Microsoft YaHei;"><span style="font-size: 18px;">par(new=T,mar=c(4,4,4,4))
points(accratio*10000~c((1:length(accratio)-0.5)),new=FALSE,type="b",new=T)
axis(4,col="red",col.axis="red",at=0:10000,label=c(0:10000/10000))
mtext("累积百分比",4,2)
points(6.5,accratio[7]*10000,col="red")
text(7,accratio[7]*10000,paste(round(accratio[7]+0.00001,4)*100,"%")) </span><span style="font-size:18px;">
</span></span>
point加点;axis右边坐标轴,mtext右边坐标轴的名称,text给出本文。

12、图形添加物
有添加线lines、点points、图例legend等其他。
legend(x, y, legend, ...) :在当前图的特定位置增加图例(legend)。标识字符,线条格式,颜色等都是被字符向量legend 中的标签所注释。另外一个含有画图单位对应值的参数v (一个和legend 长度一致的向量)是必须给定的:
legend(x,y,fill=v,col=v,lty=v, lwd=v,pch=v)
#legend( , fill=v)填充盒子的颜色
#legend( , col=v)点或者线条的颜色
#legend( , lty=v)线条样式
#legend( , lwd=v)线条宽度
#legend( , pch=v)标识字符(字符向量)
详细可参考:http://blog.sina.com.cn/s/blog_5de124240101q5vw.html
