Lesson 2 Gradient Desent
首先引用下郑海波师兄的博文
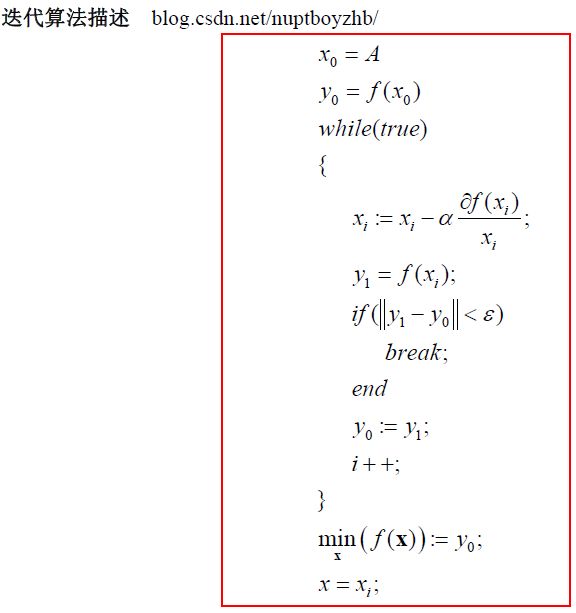
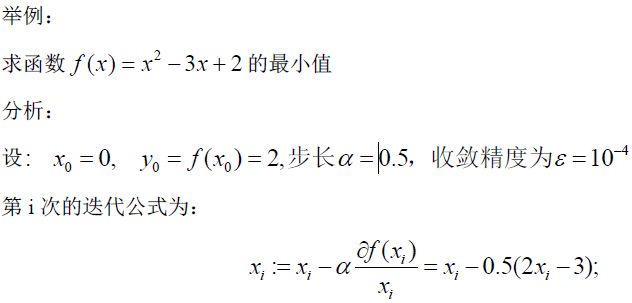
梯度下降法是一个一阶最优化算法,通常也称为最速下降法。我之前也没有关注过这类算法。最近,听斯坦福大学的机器学习课程时,碰到了用梯度下降算法求解线性回归问题,于是看了看这类算法的思想。今天只写了一些入门级的知识。
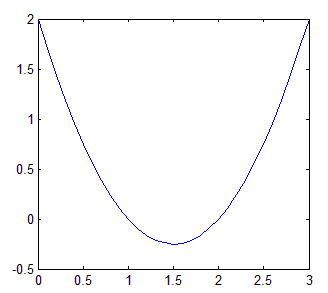
我们知道,函数的曲线如下:
编程实现:c++ code
/*
* @author:郑海波
* blog.csdn.net/nuptboyzhb/
* 2012-12-11
*/
#include <iostream>
#include <math.h>
using namespace std;
int main()
{
double e=0.00001;//定义迭代精度
double alpha=0.5;//定义迭代步长
double x=0;//初始化x
double y0=x*x-3*x+2;//与初始化x对应的y值
double y1=0;//定义变量,用于保存当前值
while (true)
{
x=x-alpha*(2.0*x-3.0);
y1=x*x-3*x+2;
if (abs(y1-y0)<e)//如果2次迭代的结果变化很小,结束迭代
{
break;
}
y0=y1;//更新迭代的结果
}
cout<<"Min(f(x))="<<y0<<endl;
cout<<"minx="<<x<<endl;
return 0;
}
//运行结果
//Min(f(x))=-0.25
//minx=1.5
//Press any key to continue
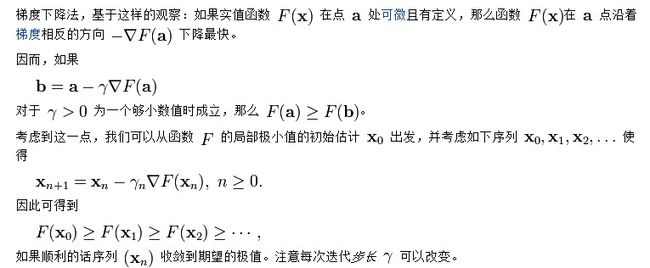
其次,看下wiki中的解释
说一下我的个人对gradient descent的理解。以前看过最小二乘法,原理跟这个差不多,设f(a0,a1,a2,...an)是对样本点n次多项式的模拟,要算h = sum (f-y)^2 在所有样本点(x1,x2..xm)的最小值。这里h代表了模拟曲线与所有样本点距离和。对h对a0,a1...an求偏导,并令偏导为0,得到h的极小值点。这样就可以得到模拟多项式前面的参数了
先说下机器学习中的一些符号
Notation:
m = #training examples #表示数量
x = input variables / features
y = output variables / target variable
(x,y) training example
xi,yi ith training example
下面说一下梯度下降法:
设h(x) = sum(aixi), i from 0 to n,n = #features表示学习问题中特征的数目
写成向量相乘的方式即为:h(x) = transpose(A)X
A(a0,a1...an) are called parameters
如何确定A呢?
跟最小二乘法一样,只需要模拟曲线与各样本点的距离平方和最小,即使(h(x) - y)^2最小即可
令J(A) = 1/2 * sum( (h(x)_j-y_j)^2 ), j from 1 to m,表示样本点的个数,注意每一个样本点可能有i个特征值
所以我们的目标就是求A,便得J(A)最小
为了使J(A)最小,有几种算法
search algorithm
start with some A
Keep changing A to reduce J
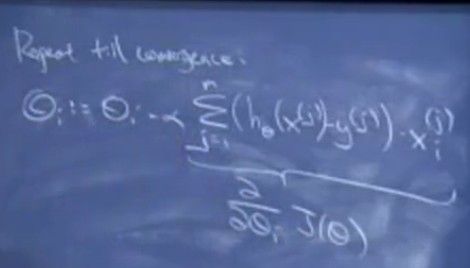
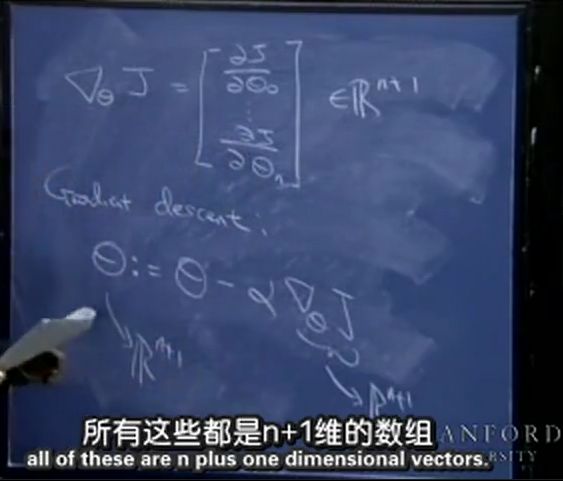
然后对J相对于ai求偏导,即目标函数的梯度向量
课程中的theta相当于我这里的系数a
开始随便确定一组系数A,根据J的样本点求得J(A)在此点的偏导,然后一直迭代系数直到J(A)收敛
不过这种方法当样本数很大的时候,每迭代一步算偏导时计算量会很大
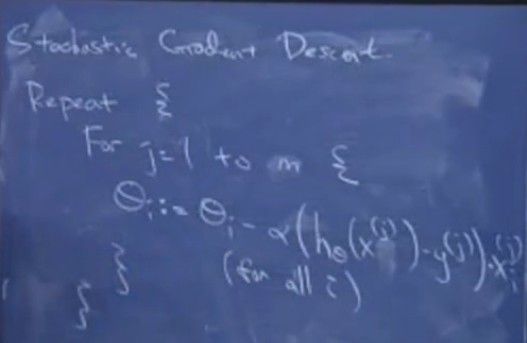
所以引入了另一种方法,叫stochastic gradient descent
or incremental gradient descent
这个算法与第一个算法的差别是:
第一个算法每迭代一次都要进行m次运算,而这个算法每次迭代只在一个样本点算一次偏导数,这样迭代一次就快多了,从而参数的调整速度也快多了,因为你不必遍历所有样本数据才进行一次迭代,比如m为100万个样本。
/////////////////////////////////////////////////////////////////////另外写成矩阵形式(附加内容)
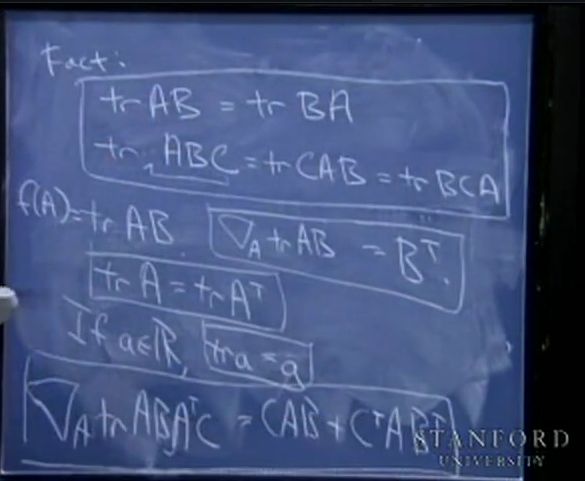
先给出一些定义
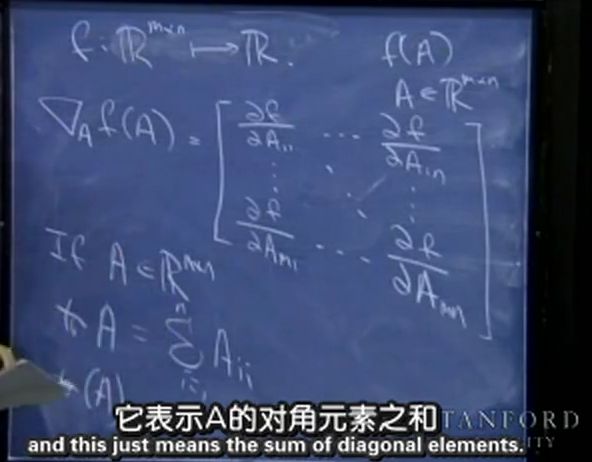
梯度向量
tr代表矩阵的秩(trace)
这些公式没有证明,自己去证明
一会将用到这5个公式
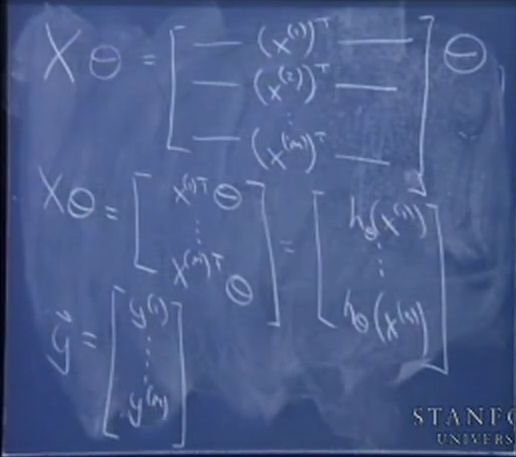
将X写成如下形式:
其中
注意前面h(x)的定义:设h(x) = sum(aixi), i from 0 to n,n = #features表示学习问题中特征的数目
注意这里的θ向量是题目中(a1,a2,...,an)组成的列向量,即我们所需要求的xi前面的系数
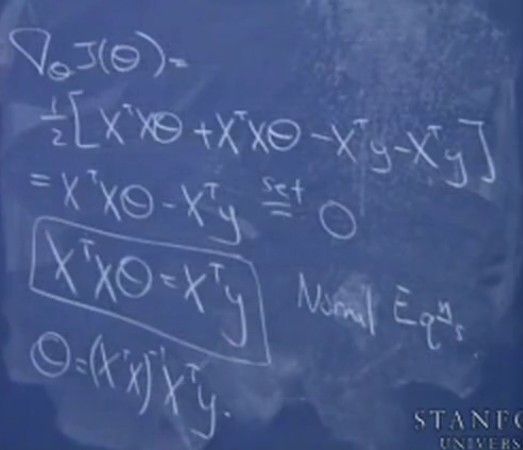
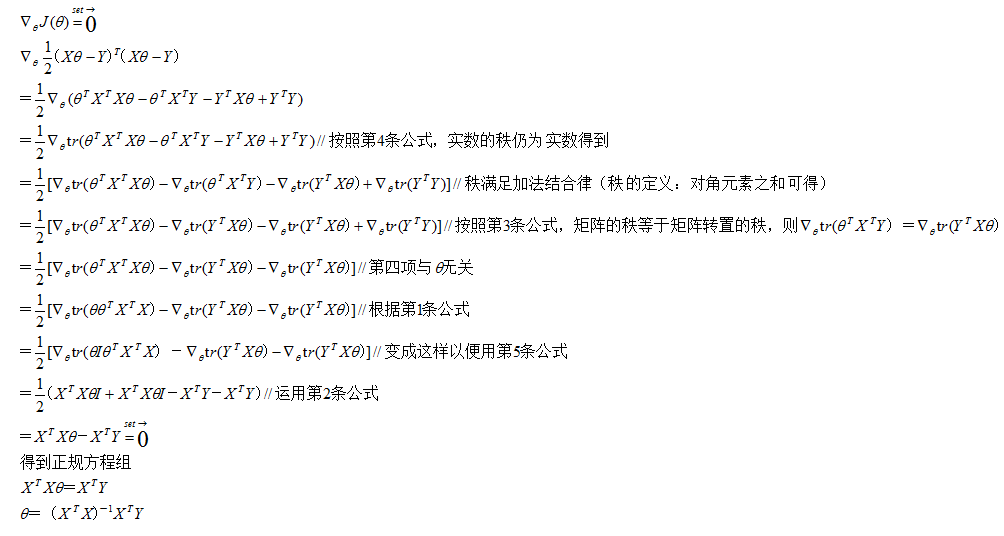
整个推导过程如下:
好吧,接着我们可以开始实战了
来求下二元函数的最小值 f(x1, x2) = x1 ^ 2 + x1 * x2 + 3 * x2 ^ 2
首先,用C++来写
#include <iostream>
#include <math.h>
using namespace std;
int main()
{
	double e = 0.000001;
	double alpha = 0.1;
	double x1 = 3, x2 = 3;
	double y0 = x1 * x1 + x1 * x2 + 3 * x2 * x2;
	double y1 = 0;
	double g1 = 0, g2 = 0;
	while (true)
	{
		g1 = 2 * x1 + x2;
		g2 = x1 + 6 * x2;
		x1 = x1 - alpha * g1;
		x2 = x2 - alpha * g2;
		y1 = x1 * x1 + x1 * x2 + 3 * x2 * x2;
		if (abs(y1 - y0) < e)
			break;
		y0 = y1;
	}
	cout << "Min(f(x1, x2)) = " << y0 << endl;
	cout << "Min(x1) = " << x1 << endl << "Min(x2) = " << x2 << endl;
	return 0;

}
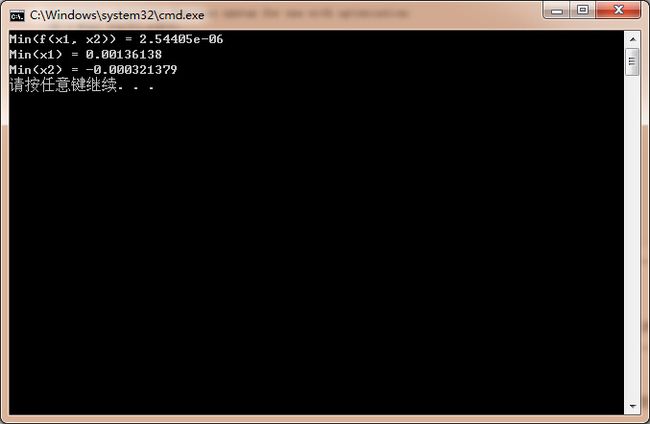
运行结果如下:
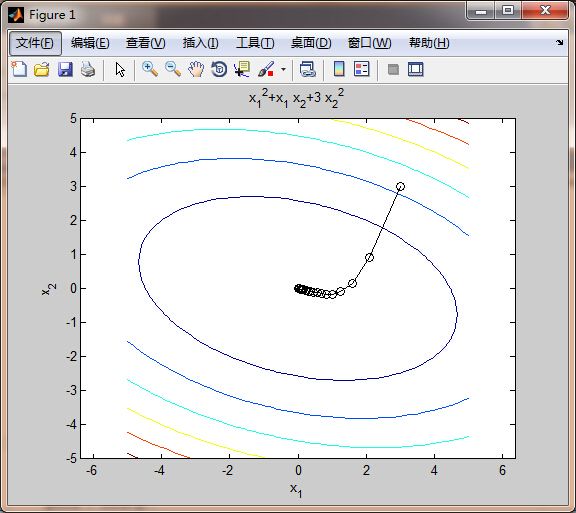
然后再用matlab画出来
function [xopt,fopt,niter,gnorm,dx] = grad_descent(varargin)
% grad_descent.m demonstrates how the gradient descent method can be used
% to solve a simple unconstrained optimization problem. Taking large step
% sizes can lead to algorithm instability. The variable alpha below
% specifies the fixed step size. Increasing alpha above 0.32 results in
% instability of the algorithm. An alternative approach would involve a
% variable step size determined through line search.
%
% This example was used originally for an optimization demonstration in ME
% 149, Engineering System Design Optimization, a graduate course taught at
% Tufts University in the Mechanical Engineering Department. A
% corresponding video is available at:
%
% http://www.youtube.com/watch?v=cY1YGQQbrpQ
%
% Author: James T. Allison, Assistant Professor, University of Illinois at
% Urbana-Champaign
% Date: 3/4/12

if nargin==0
    % define starting point
    x0 = [3 3]';
elseif nargin==1
    % if a single input argument is provided, it is a user-defined starting
    % point.
    x0 = varargin{1};
else
    error('Incorrect number of input arguments.')
end

% termination tolerance
tol = 1e-6;

% maximum number of allowed iterations
maxiter = 1000;

% minimum allowed perturbation
dxmin = 1e-6;

% step size ( 0.33 causes instability, 0.2 quite accurate)
alpha = 0.1;

% initialize gradient norm, optimization vector, iteration counter, perturbation
gnorm = inf; x = x0; niter = 0; dx = inf;

% define the objective function:
f = @(x1,x2) x1.^2 + x1.*x2 + 3*x2.^2;

% plot objective function contours for visualization:
figure(1); clf; ezcontour(f,[-5 5 -5 5]); axis equal; hold on

% redefine objective function syntax for use with optimization:
f2 = @(x) f(x(1),x(2));

% gradient descent algorithm:
while and(gnorm>=tol, and(niter <= maxiter, dx >= dxmin))
    % calculate gradient:
    g = grad(x);
    gnorm = norm(g);
    % take step:
    xnew = x - alpha*g;
    % check step
    if ~isfinite(xnew)
        display(['Number of iterations: ' num2str(niter)])
        error('x is inf or NaN')
    end
    % plot current point
    plot([x(1) xnew(1)],[x(2) xnew(2)],'ko-')
    refresh
    % update termination metrics
    niter = niter + 1;
    dx = norm(xnew-x);
    x = xnew;

end
xopt = x;
fopt = f2(xopt);
niter = niter - 1;

% define the gradient of the objective
function g = grad(x)
g = [2*x(1) + x(2)
    x(1) + 6*x(2)];
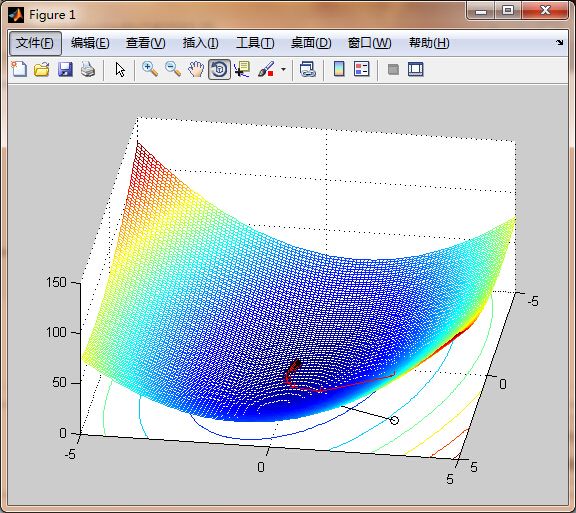
然后再改造一下,变成三维的,
function [xopt,fopt,niter,gnorm,dx] = grad_descent(varargin)


if nargin==0
    % define starting point
    x0 = [3 3]';
elseif nargin==1
    % if a single input argument is provided, it is a user-defined starting
    % point.
    x0 = varargin{1};
else
    error('Incorrect number of input arguments.')
end

% termination tolerance
tol = 1e-6;

% maximum number of allowed iterations
maxiter = 1000;

% minimum allowed perturbation
dxmin = 1e-6;

% step size ( 0.33 causes instability, 0.2 quite accurate)
alpha = 0.1;

% initialize gradient norm, optimization vector, iteration counter, perturbation
gnorm = inf; x = x0; niter = 0; dx = inf;

% define the objective function:
f = @(x1,x2) x1.^2 + x1.*x2 + 3*x2.^2;

m = -5:0.1:5;
[X,Y] = meshgrid(m);
Z = f(X,Y);

% plot objective function contours for visualization:
figure(1); clf; meshc(X,Y,Z); hold on

% redefine objective function syntax for use with optimization:
f2 = @(x) f(x(1),x(2));

% gradient descent algorithm:
while and(gnorm>=tol, and(niter <= maxiter, dx >= dxmin))
    % calculate gradient:
    g = grad(x);
    gnorm = norm(g);
    % take step:
    xnew = x - alpha*g;
    % check step
    if ~isfinite(xnew)
        display(['Number of iterations: ' num2str(niter)])
        error('x is inf or NaN')
    end
    % plot current point
    plot([x(1) xnew(1)],[x(2) xnew(2)],'ko-')
    plot3([x(1) xnew(1)],[x(2) xnew(2)], [f(x(1),x(2)) f(xnew(1),xnew(2))]...
        ,'r+-');
    refresh
    % update termination metrics
    niter = niter + 1;
    dx = norm(xnew-x);
    x = xnew;

end
xopt = x;
fopt = f2(xopt);
niter = niter - 1;

% define the gradient of the objective
function g = grad(x)
g = [2*x(1) + x(2)
    x(1) + 6*x(2)];

