MATLAB二维、三维布朗运动和球面均匀分布

作者:金良([email protected]) csdn博客:http://blog.csdn.net/u012176591
1.二维
矩形区域内布满了随机分布的点,这些点在此矩形区域内随机运动。最初某个点是红色的,区域点是蓝色的。当一个红色的点和蓝色的点的距离小于某个门限值时,蓝色的点以一定的概率变成红色。
要求动态可视化显示程序运行过程。
MATLAB代码:
clear;
N=500;
length = 1000;
width = 500;
mvDelta = 35;
angle = 0;
rangeTransmitter = 10;
steps = 10000;
alfa = 0.2;
locMat=[length*rand(N,1),width*rand(N,1)];
locMat(:,3)=zeros(N,1);
locMat(floor(rand*N),3) = 1;
figure()
for i =1:steps
    angle = 2*pi*rand(N,1)*[1,1];
    move = mvDelta*[cos(angle(:,1)),sin(angle(:,2))];
    locMat(:,1:2) = locMat(:,1:2) + move(:,1:2);
    for j = 1:size(locMat)
        if(locMat(j,1) <= 0||locMat(j,1)>= length||locMat(j,2) <= 0||locMat(j,2)>= width)
            locMat(j,1:2) = locMat(j,1:2)-move(j,1:2);
        end
    end
    for j = 1:size(locMat)
        for k = j+1:size(locMat)
            if rangeTransmitter > norm(locMat(j,1:2)-locMat(k,1:2))
                if rand < 0.2
                    if locMat(j,3)-locMat(k,3) == 1
                        locMat(k,3) = 1;
                    elseif locMat(j,3) - locMat(k,3) == -1
                        locMat(j,3) = 1;
                    end
                end
            end
        end
    end

    hold off;
    plotNode(locMat,5)
    axis([0 length 0 width])
    pause(0.0005)
end
function y = plotCircle(locMat,rangeTransmit)
alfa = 0:2*pi/1000:2*pi;
plot([0],[0],'k.')
for i = 1:size(locMat)
    circleX = locMat(i,1)+rangeTransmit*cos(alfa);
    circleY = locMat(i,2)+rangeTransmit*sin(alfa);
    hold on;
    if 1 == locMat(i,3)
        plot(circleX,circleY,'r');
    else
        plot(circleX,circleY,'b');
    end
end
运行过程截图:
光源向二维空间发射光子示意图:
代码:
clear;
N=500;
length = 550;
width = 550;
center = [length/2,width/2];
R = 250;
steps = 10000;
figure()
grid;
for i =1:steps
    angle = [2*pi*rand];
    locEnd = R*[sin(angle(1)),cos(angle(1))]+center;
    plot(locEnd(1),locEnd(2),'r.');
    hold on;
    grid;
    axis([0 length 0 width])
    pause(0.0005)
end
2.三维
clear;
N=500;
length = 1000;
width = 500;
height = 1500;
mvDelta = 35;
angle = 0;
rangeTransmitter = 100;
steps = 10000;
alfa = 0.2;
locMat=[length*rand(N,1),width*rand(N,1),height*rand(N,1)];
locMat(:,4)=zeros(N,1);
locMat(floor(rand*N),4) = 1;
disp('begin');
figure()
plot3(locMat(:,1),locMat(:,2),locMat(:,3),'.');
grid;
for i =1:steps
    angle = [2*pi*rand(N,1),2*pi*rand(N,1)];

    move = mvDelta*[sin(angle(:,1)).*cos(angle(:,2)),sin(angle(:,1)).*sin(angle(:,2)),cos(angle(:,1))];
    locMat(:,1:3) = locMat(:,1:3) + move(:,1:3);
    for j = 1:size(locMat)
        if(locMat(j,1) <= 0||locMat(j,1)>= length||locMat(j,2) <= 0||locMat(j,2)>= width||locMat(j,3) <= 0||locMat(j,3) >= height)
            locMat(j,1:3) = locMat(j,1:3)-move(j,1:3);
        end
    end
    for j = 1:size(locMat)
        for k = j+1:size(locMat)
            if rangeTransmitter > norm(locMat(j,1:3)-locMat(k,1:3))
                if rand < 0.2
                    if locMat(j,4)-locMat(k,4) == 1
                        locMat(k,4) = 1;
                        disp('message1');
                    elseif locMat(j,4) - locMat(k,4) == -1
                        locMat(j,4) = 1;
                        disp('message2');
                    end
                end
            end
        end
    end

    hold off;
    %plotNode(locMat,5)
    %plot3(locMat(:,1),locMat(:,2),locMat(:,3),'.');
    for j = 1:size(locMat)
        if locMat(j,4)==1
            plot3(locMat(j,1),locMat(j,2),locMat(j,3),'r.');
        else
            plot3(locMat(j,1),locMat(j,2),locMat(j,3),'k.');
        end
        hold on;
    end
    hold off;

    grid;
    axis([0 length 0 width 0 height])
    pause(0.0005)
end
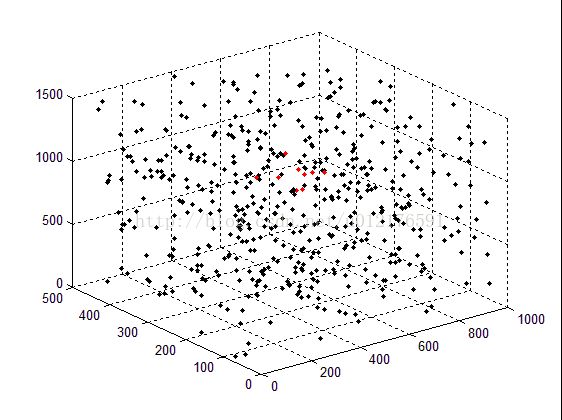
仿真过程:
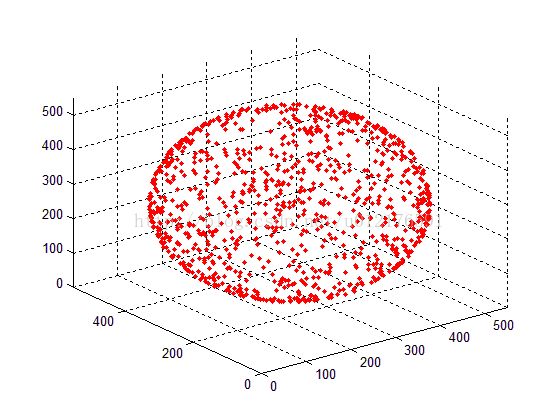
光源向空间均匀地发射光子图:
代码:
clear;
N=500;
length = 550;
width = 550;
height = 550;
center = [length/2,width/2,height/2];
R = 250;
steps = 10000;
figure()
grid;
for i =1:steps
    angle = [2*pi*rand,2*pi*rand];
    locEnd = R*[sin(angle(1)).*cos(angle(2)),sin(angle(1)).*sin(angle(2)),cos(angle(1))]+center;
    plot3(locEnd(1),locEnd(2),locEnd(3),'r.');
    hold on;
    grid;
    axis([0 length 0 width 0 height])
    pause(0.0005)
end
3.运动方向解析
突然发现这种方法只是一种近似,没有严格地数学推导,从图像来看并非是随机的。
4.均匀发射的正确方法(以三维球面为例)
方法1:
点的坐标取法:
生成三个均值为0,方差为1的高斯随机数,然后对它们三个进行归一化,归一化后的这三个数分别作为新产生的点的x、y、z坐标。
代码:
clear;
N=500;
length = 550;
width = 550;
height = 550;
center = [length/2,width/2,height/2];
R = 250;
steps = 1000;
figure()
grid;
for i =1:steps
    vec = normrnd(0,1,1,3);
    locEnd = R*vec/sqrt(sum(vec.^2))+center;
    plot3(locEnd(1),locEnd(2),locEnd(3),'r.');
    hold on;
    grid;
    axis([0 length 0 width 0 height])
    pause(0.0005)
end
grid;
方法2:
代码:
clear;
N=500;
length = 550;
width = 550;
height = 550;
center = [length/2,width/2,height/2];
R = 250;
steps = 1000;
figure()
grid;
for i =1:steps
    vec = rand(1,3)-0.5;
    if sum(vec.^2) >1
        i = i-1;
        continue;
    else
        vec = vec./sqrt(sum(vec.^2))
    end
    locEnd = R*vec+center;
    plot3(locEnd(1),locEnd(2),locEnd(3),'r.');
    hold on;
    grid;
    axis([0 length 0 width 0 height])
    pause(0.0005)
end
grid;

参考文献
- 二维、三维旋转矩阵(Rotation matrix)
http://en.wikipedia.org/wiki/Rotation_matrix


