Falcon Pro
I recently installed Falcon Pro, a new Twitter client, on my Nexus 4. I really enjoy using this application but I noticed a few hiccups here and there while using it and it seemed that scrolling the main timeline did not yield a perfectly stable framerate. I dug a little bit with some of the tools and techniques I use every day at work and I was able to quickly find some of the reasons why Falcon Pro does not behave as well as it can.
My goal in this article is to show you how you can track down and fix performance issues in an application, even if you don’t have its source code. All you need is a copy of the latest Android 4.2 SDK – the new ADT bundle makes setup a breeze. I would highly recommend you download the application to apply the techniques described here on your own. Falcon Pro is unfortunately – for you – a paid application and I will therefore provide links to various files you can download to follow my analysis.
A word about performance
Android 4.1 put focus on performance with Project Butter and it brought new performance analysis tools, such as systrace. Android 4.2 does not offer anything as significant as systrace but offers a couple of useful addition to your toolbox. You will discover one of these new tools later in this article.
Performance analysis is often a complex task that requires a lot of experience and a deep knowledge of one’s tools, hardware, APIs, etc. It is experience that allowed me to perform the analysis presented here in only a few minutes – you can see it happen in “real time” on my Twitter stream on December 1st. It will likely take you a few tries before you feel at ease with this kind of work.
Confirming my suspicions
One of the most important things to remember about performance work is to always use measurements to validate your actions. Even though it seemed obvious to me that Falcon Pro was suffering from framerate drops on a Nexus 4, I needed to make sure. I therefore installed the application on a Nexus 7 which, while powerful, offers a different performance profile than Nexus 4. Nexus 7 offers another interesting advantage for performance analysis that we’ll talk about later.
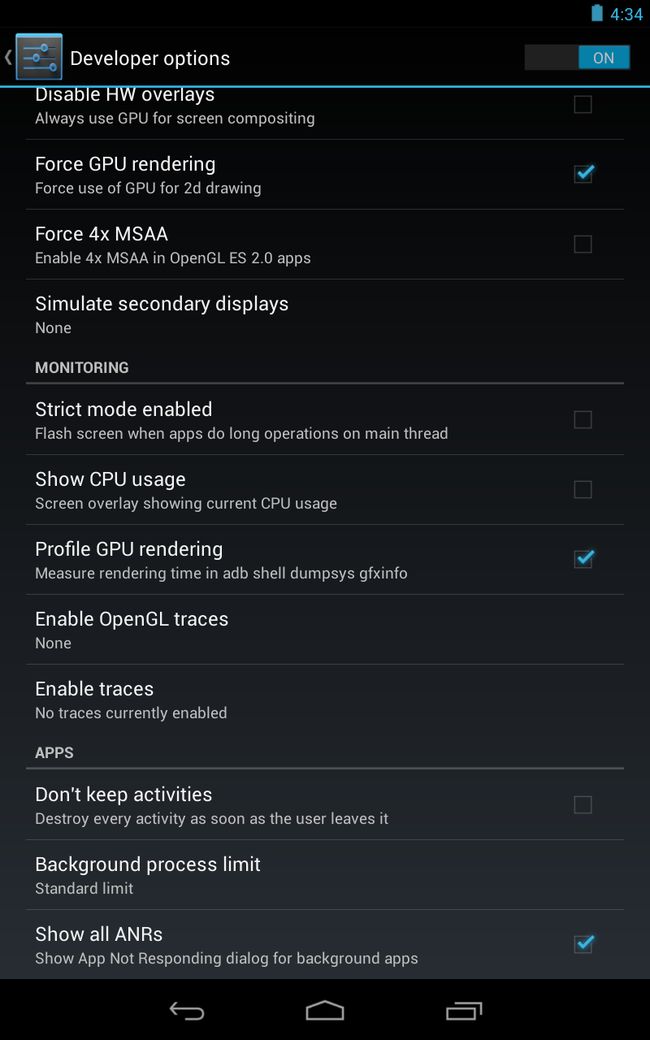
Installing the application on Nexus 7 did not make a difference and I could still see framerate drops. It even seemed slightly worse. To measure the problem I decided to use a Profile GPU rendering, a tool introduced in Android 4.1. You can find this tool in the Developer options section of the Settings application.
If Developer options is not available on your device running Android 4.2, go to the About phone or About tablet section and tap the Build number item at the bottom 7 times.
With this option turned on, the system will keep track of the time it took to draw the last 128 frames of every window. To use this tool you must now kill your application – a future version of Android will get rid of this requirement.
Methodology: unless specified otherwise, every measurement in this analysis is done by slowly scrolling the main timeline up and down by a few pixels at a time, revealing at most one extra list item.
After launching the application and scrolling the main timeline, I ran the following command from a terminal:
$ adb shell dumpsys gfxinfo com.jv.falcon.pro
In the resulting logs you will find a section entitled Profile data in ms. This section contains, for each window belonging to the application, a table of 3 columns. To use this data, simply copy the table in your favorite spreadsheet program and generate a stacked columns chart. The chart below is the result of my measurement (the original spreadsheet can be viewed online.)
Each column gives an estimate of how long each frame takes to render:
-
Draw is the time spent building display lists in Java. It indicates how much time is spent running methods such as View.onDraw(Canvas).
-
Process is the time spent by Android’s 2D renderer to execute the display lists. The more Views in your hierarchy, the more drawing commands must be executed.
-
Execute is the time it took to send a frame to the compositor. This part of the graph is usually small.
Reminder: to render smoothly at 60 fps, each frame must take less than 16 ms to complete.
About Execute: if Execute takes a long time, it means you are running ahead of the graphics pipeline. Android can have up to 3 buffers in flight and if you need another one the application will block until one of these bufferes is freed up. This can happen for two reasons. The first one is that your application is quick to draw on the Dalvik side but its display lists take a long time to execute on the GPU. The second reason is that your application took a long time to execute the first few frames; once the pipeline is full it will not catch up until the animation is done. This is something we’d like to improve in a future version of Android.
The chart obviously confirms my suspicions: while the application mostly performs well, it sometimes drops a frame.
Taking a closer look
Even though the data we gathered shows that the application sometimes takes too long to draw, it doesn’t tell the whole story. The framerate can also be affected by unscheduled or mischeduled frames. For instance, if an app always draws in less than 16 ms but sometimes performs long tasks between frames, it will sometimes miss a frame.
Systrace is the easiest tool to check whether Falcon Pro is suffering from this issue. This tool is a system profiler with very low overhead. Its timings are reasonably accurate and give you an overview of what the entire system is doing, including your application.
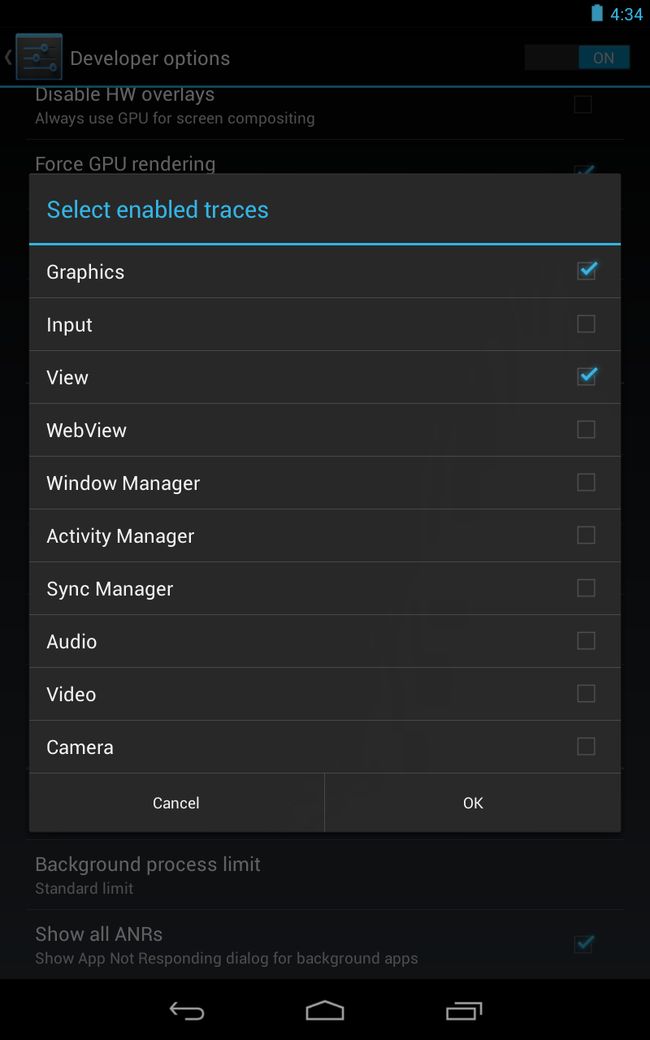
To enable systrace, go to Developer options and select Enable traces. A dialog appears, letting you choose what type of events you want to profile. We are only interested in Graphics and View.
Note: do not forget to turn off Profile GPU rendering.
To use systrace, open a terminal and from the directory tools/systrace in the Android SDK, run systrace.py:
$ ./systrace.py
By default, the tool will capture events for 5 seconds. I simply scrolled the main timeline up and down. The resulting trace is a stand-alone HTML document.
Tip: to navigate a systrace document, use the WASD keys to pan and zoom. W will zoom in on the mouse cursor.
A systrace document shows a lot of very interesting information. For instance, it shows you whether a process is scheduled, and on which CPU. If you zoom in on the last row, called 10440: m.jv.falcon.pro you can see what the application was doing. If you click on one of the performTraversals blocks you can see how long the application spent drawing a frame.
While most of the performTraversals are below the 16 ms threshold, some take more time, thus confirming the measurements previously obtained (zoom in at the 935 ms marker to see such a block.)
More interestingly, you can see that the application sometimes misses a frame because it doesn’t manage to schedule a draw operation. Zoom in at the 270 ms marker to find a deliverInputEvent block taking 25 ms. This blocks indicates that the application spent 25 ms processing a touch event. Since the application is using a ListView, this is likely due to a problem in the adapter but we’ll get back to this later.
Systrace was useful to not only confirm that the application is spending too much time drawing, but also to help us find another potential performance bottleneck. It is a very useful tool but it has its limitations. It only provides high level data and we must turn to other tools to understand what is truly going on.
Visualizing overdraw
Drawing performance issues can have many root causes but a common one is overdraw. Overdraw happens every time the application asks the system to draw something on top of something else. Think about the simplest application possible: a window with a white background and a single button on top of it. When the system draws the button, it draws over the existing white background. That’s overdraw.
Overdraw is inevitable but too much overdraw can be an issue. Devices have limited memory bandwidth and if overdraw causes your application to require more bandwidth than available, performance will degrade. The amount of overdraw you can reasonably afford varies from device to device.
A good rule of thumb is to aim for a maximum overdraw of 2x; this means you can draw the screen once, then draw twice again on top, painting each pixel 3 times total.
The presence of overdraw also usually indicates other problems: too many views, complex hierarchy, longer inflation times, etc.
Android offers 3 tools to help identify and fix overdraw: Hierarchy Viewer, Tracer for OpenGL and Show GPU overdraw. The first two can be found in ADT or the stand-alone monitor tool. The last tool is part of Developer options.
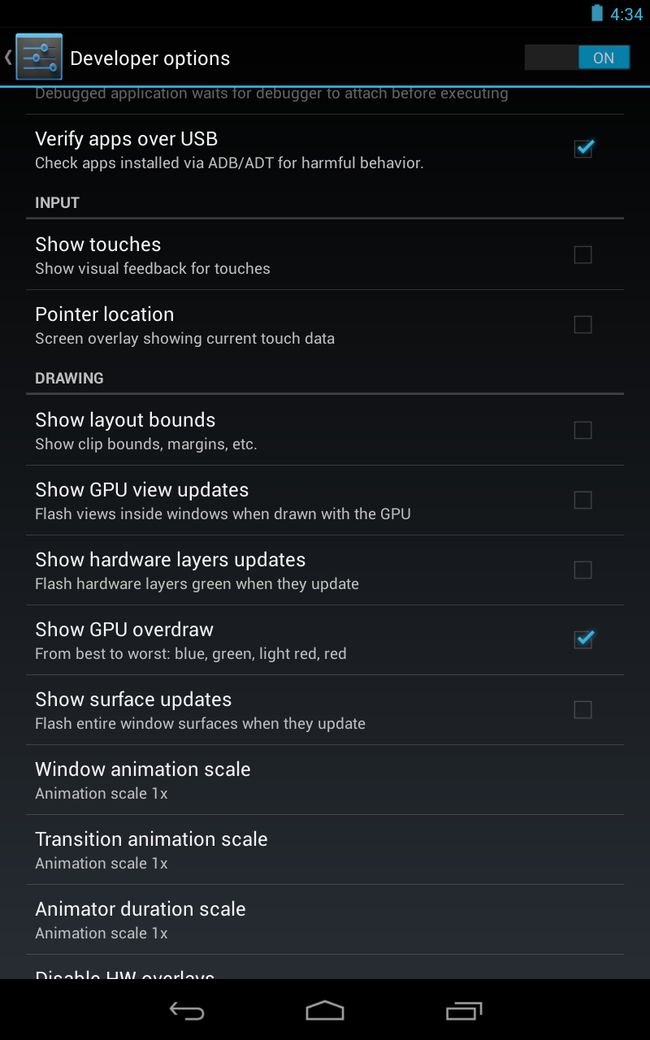
Show GPU overdraw paints the screen in different colors to indicate where overdraw occurs, and how much. Turn it on now and don’t forget to kill your application – a future version of Android will remove this requirement.
Before we look at Falcon Pro, let’s see what the Settings application looks like with Show GPU overdraw turned on.
It is easy to interpret the results if you remember the meaning of each color:
- No color means there is no overdraw. The pixel was painted only once. In this example, you can see that the background is intact.
- Blue indicates an overdraw of 1x. The pixel was painted twice. Large blue areas are acceptable (if the entire window is blue, you can get rid of one layer.)
- Green indicates an overdraw of 2x. The pixel was painted three times. Medium-sized green areas are acceptable but you should try to optimize them away.
- Light red indicates an overdraw of 3x. The pixel was painted four times. Small light red areas are acceptable.
- Dark red indicates an overdraw of 4x or more. The pixel was painted 5 times or more. This is wrong. Fix it.
Based on this information you can see that Settings is a well behaved application that does not require any extra work. There is a little bit of red in the switches but nothing worth our efforts.
Transparent pixels: look closely at the previous screenshots. Each icon is painted blue. You can see that the transparent pixels of the bitmaps count against your overdraw. Transparent pixels must be processed by the GPU and can be expensive. Android uses optimizations to avoid drawing transparent pixels in layers and 9-patches so you should only worry about bitmaps.
Overdraw and the GPU: there are two type of mobile GPU architectures. The first uses deferred rendering, for instance ImaginationTech’s SGX series. This architecture allows the GPU to detect and fix overdraw in specific situations (it doesn’t work if you are blending transparent or translucent pixels.) The second architecture uses immediate rendering and can be found in NVIDIA’s Tegra GPUs. This architecture cannot optimize overdraw for you, which is why I like to test on Nexus 7. There are many advantages and disadvantages to both architectures but it’s beyond the scope of this article. Just know that both work really well.
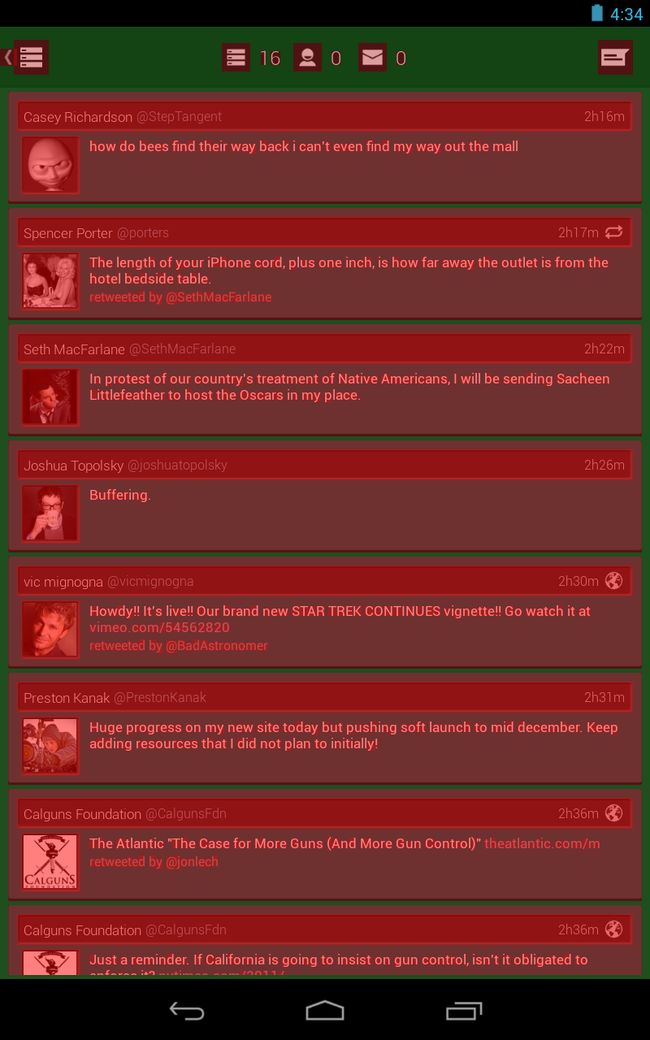
Let’s now take a look at Falcon Pro…
There is a lot of red in that screenshot! What is interesting however is that the list background is green. This shows there’s a 2x overdraw before the application even starts drawing its content. The problem we see here is most likely related to having several fullscreen backgrounds. It is usually trivial to fix.
Removing extraneous layers
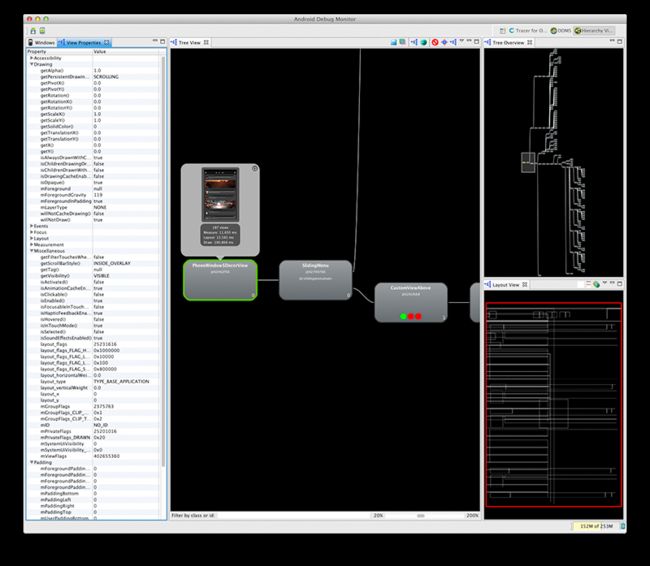
To reduce overdraw we must first understand where it’s coming from. This is where Hierarchy Viewer and Tracer for OpenGL before useful. Hierarchy Viewer is part of ADT (or monitor) and can be used to inspect a snapshot of the View hierarchy. It is especially useful to debug layout issues but comes in handy for performance work as well.
Important: Hierarchy Viewer will only work on non-secure devices by default, such as engineering phones and tablets or the emulator. To use Hierarchy Viewer on any phone add ViewServer, an Open Source library, to your application.
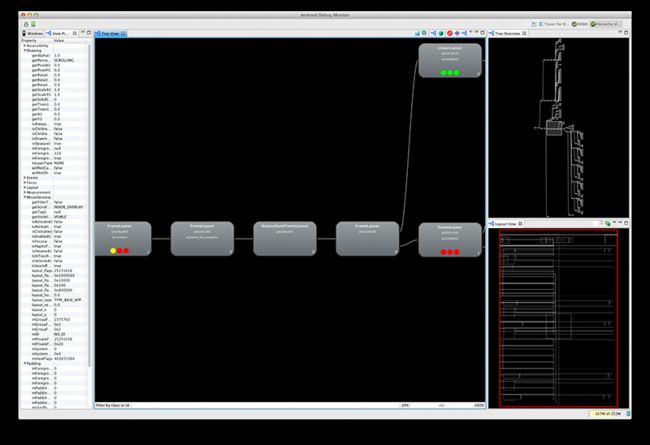
Open the Hierarchy Viewer perspective in ADT (or monitor), then select the Windows tab. The window highlighted in bold is the foreground window on the device and usually the one you want to inspect. Click on it then click the Load button in the toolbar (it looks like a tree of blue squares.) Loading the tree can take a while so be patient. When the tree is ready you should see something similar to the picture below.
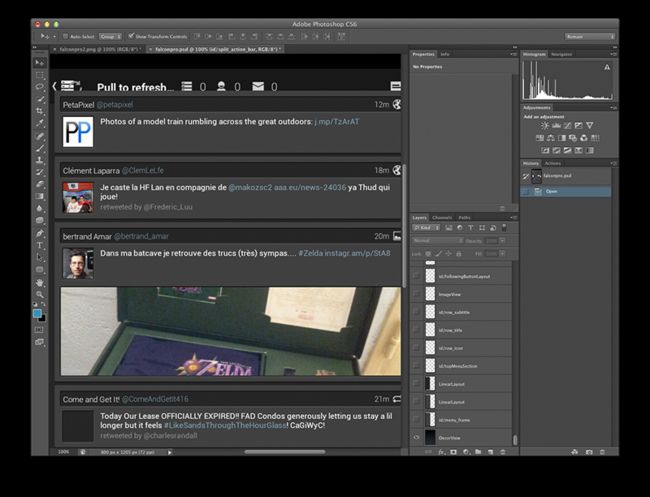
Now that the View hierarchy is loaded in the tool we can export it as a Photoshop document. To do so, click the second button in the toolbar – the tooltip says “Capture the window layers […]”. Adobe Photoshop itself is not required as the generated document is compatible with tools such as Pixelmator, The GIMP, etc. The PSD file I generated is available for download.
The Photoshop document shows one layer per View in the application. Each layer is marked visible or invisible, based on the return value of View.getVisibility(). Each layer is named after its View, using either the View android:id if available or its class name. I once started adding support for groups to recreate the View tree… I should really finish this feature.
By inspecting the list of layers, we can quickly identify at least one source of overdraw: multiple fullscreen backgrounds. The first one is the first layer, called DecorView. This view is generated by Android and contains the background specified in the theme. This default gradient is invisible in the application so it can be safely removed.
Scrolling up from DecorView you can see a LinearLayout containing another fullscreen gradient background. This is the same exact background as DecorView’s and it is therefore unnecessary. The only visible background that must remain belongs to the View called id/tweet_list_container.
Removing the window background: the background defined in your theme is used by the system to create preview windows when launching your application. Never set it to null unless your application is transparent. Instead, set it to the color/image you want or get rid of from onCreate() by calling getWindow().setBackgroundDrawable(null).
Further reducing overdraw
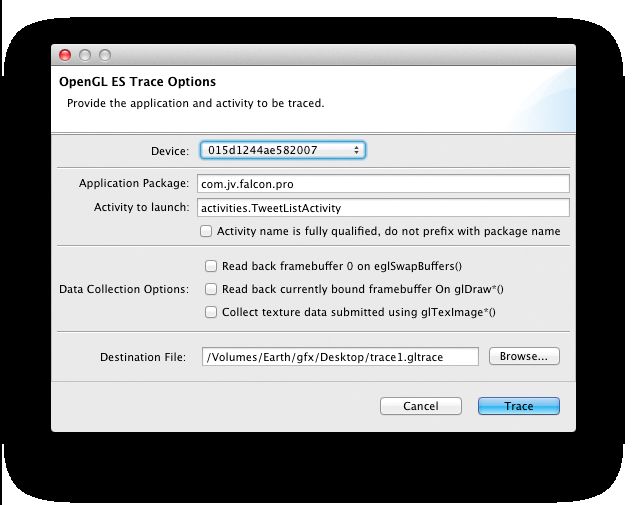
The Photoshop document is useful to understand how the application is built but it is a little bit difficult to use to get rid of smaller overdraw regions. We must now turn to Tracer for OpenGL. Open the perspective of the same name in ADT (or monitor) and click the arrow icon in the toolbar. Enter the package name of your app and the name of the main Activity, then select a destination file and click Trace.
Word of advice: OpenGL traces can be huge and really slow to capture. To make them smaller and capture faster, uncheck all the Data Collection Ooptions boxes.
Activity name: logcat will show the name of the package and Activity when you launch an application. This is how I know what to type in Tracer for OpenGL.
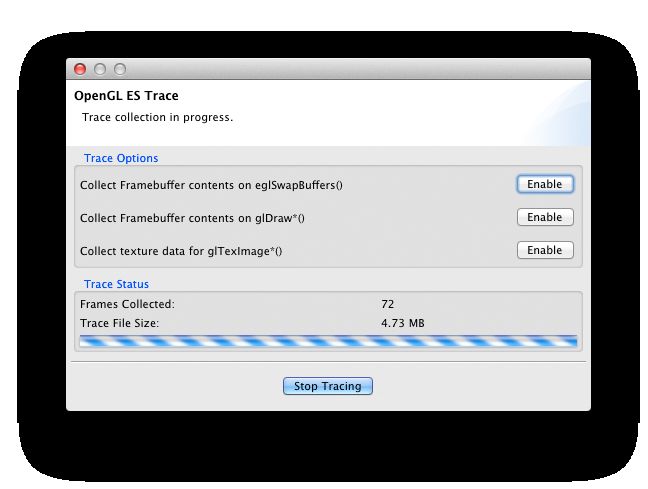
When the application is up and running, turn on the first two options:
- Collect Framebuffer contents on eglSwapBuffers()
- Collect Framebuffer contents on glDraw*()
The first option is useful to quickly find the frame you’re interested in while the second option allows us to see each frame being built drawing command by drawing command. This second option is key to solving overdraw problems.
With these two options enabled I started scrolling the main timeline. It will now take a long time to capture each frame (30 seconds is not unexpected) so I recommend you simply download the trace I captured. You can open this tracefile in Tracer for OpenGL by clicking the first button in the toolbar.
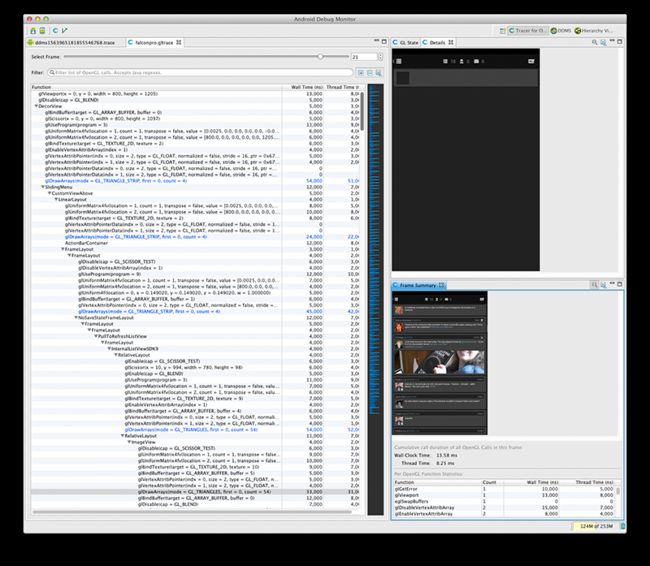
Once loaded, a trace shows you each GL command sent to the GPU for every captured frame. If you downloaded my trace file, skip to frame 21. When a frame is selected you can see what it looks like in the Frame Summary tab. In addition, you can click on drawing commands, highlighted in blue, to see the current state of the frame in the Details tab.
Organization: the GL commands are grouped by View. They recreate the same tree you can see in Hierarchy Viewer or your XML layout files. This makes it very easy to understand what View generated a specific operation.
By clicking successively on the first 3 drawing commands you can see the problem already identified in Photoshop; a fullscreen background is drawn 3 times.
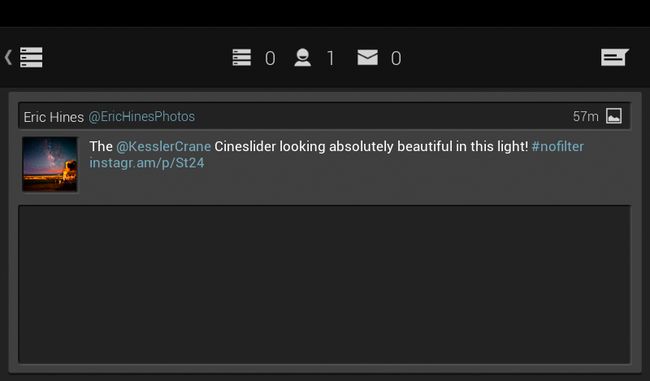
We can find more to optimize by looking further down the trace. When a tweet (list item) is drawn, an ImageView is used to draw the avatar. The ImageView first draws a background then the avatar itself:
If you look closely you will notice that the background is only used as a border for the image. This means the dark part in the center of the avatar background creates overdraw. That piece of the 9-patch is entirely covered by the avatar.
A very simple fix for this problem is to make the stretchable center piece of the 9-patch transparent. Android’s 2D renderer optimizes away transparent pieces in 9-patches. This simple change will get rid of a bit of overdraw.
Interestingly, the same exact problem occurs with inline media. Avatars are small so their overdraw is not a big deal, but inline media can occupy large areas of the screen. The fix is exactly the same.
Future optimization: I would like Android’s 2D rendering pipeline to be able to automatically detect and correct overdraw for you. We have a few ideas but I cannot make any promise. Just as with built-in GPU optimizations, this would only work with fully opaque primitives.
Flattening the view hierarchy
Now that overdraw is (mostly) taken care of, let’s go back to Hierarchy Viewer. By inspecting the tree we can try to identify unnecessary views. Removing views, especially ViewGroups, can not only help improve framerate but also memory consumption, startup time, etc.
A quick look at Falcon Pro’s view hierarchy is enough to identify several ViewGroups with a single child. These ViewGroups are often unnecessary and easy to remove. At least two of the nodes shown in the screenshot below should be removed.
There are numerous other views that can be removed from this tree. For instance, each tweet contains a RelativeLayout called id/listElementBottom. This layout contains the name of the author, his Twitter handle, the time elapsed since the tweet was posted and an icon. The name and the handle are two separate TextView instead of being just one with spans to use different styles. The time and the icon use a TextView and an ImageView that could be combined in a single TextView, using TextView’s compound drawables.
The slide-in menu on the left uses several groups of LinearLayout+TextView+ImageView to display labels with icons. Each one of these groups can be replaced by a single TextView.
How to flatten your UI: I explain these techniques in more detail in my 2009 Google I/O talk entitled Turbo-charge your UI.
What about input events?
Remember when we looked at systrace and found out that touch events handling was sometimes slow? It’s now time to address this issue and the best tool at our disposal to understand more about what the application is doing is traceview.
Traceview is a Dalvik profiler which measures how much time the application spends calling methods. To invoke it, open the DDMS perspective in ADT or monitor, select your application process in the Devices tab, then click the “Start method profiling” button (three arrows with a red circle.)
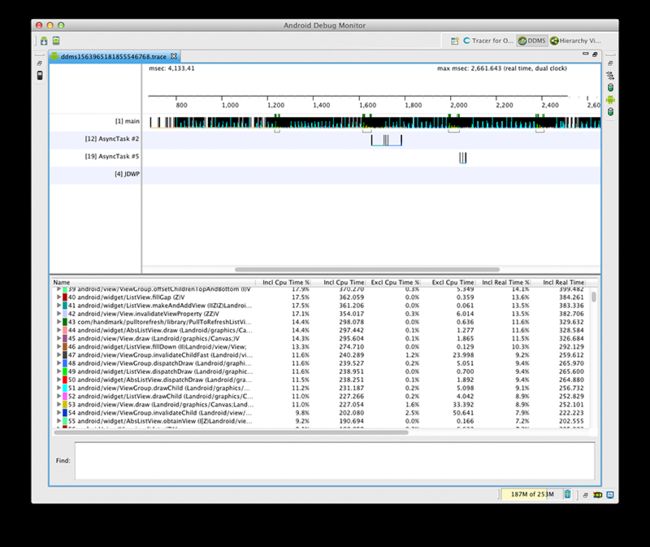
After enabling tracing, I scrolled the main timeline up and down and clicked the button again to finish the trace. You can also download my own trace. The result looks like the screenshot below.
Clicking on item #21, ViewRootImpl.draw(), highlights the time spent drawing. The last column of the table gives you an idea of the average time spent in this method and all its children. If you look closely at the timeline, with the highlights, you will notice gaps between successive frames.
An easy way to figure out what’s going in during these gaps is to zoom in at the beginning of one them and click the largest colored block you can find. You can then follow the parent chain until you find something you recognize. In my case, I followed a call to Pattern.compileImpl, taking an average of 0.5 ms, all the way up to DBListAdapter.bindView.
Obviously the application recompiles the same regular expression over and over again, every time a new item is bound while scrolling the main timeline. Traceview shows that bindView takes 38 ms on average and 56% of that time is spent parsing HTML text. This seems like something that could be achieved in the background instead of blocking the UI thread. and of course, the regex should not be recompiled every time.
It’s your turn!
I kept one last trace as an exercise. The application has two slide-in menus that can be unveiled by swiping the timeline left or right. Show GPU overdraws highlights an excessive amount of drawing during the swipes and I used Tracer for OpenGL to capture several frames of a swipe. Download my trace and see if you can figure out what’s causing the overdraw (go to frame #34.)
Hints: the application should use hardware layers by calling View.setLayerType() to simplify drawing. There are also extraneous backgrounds that can be optimized away with clever use of 9-patches. Clipping could also be very helpful. Finally, maybe a ColorFilter set on a Paint passed to setLayerType() could help remove the last drawing command.
I showed you various tools you can use to optimize your applications. I could spend a lot of time describing what techniques to use to solve issues identified with these tools but this article would turn into a book. Check out the reference documentation of the official Android developers web site and all the Google I/O Android talks (slides and videos are available online for free.)





Very good analysis. I am completely new to Android development so articles like this are a great way to avoid mistakes in the beginnings. Thank you very much!
Great write up! I think this would help the Android app community greatly if more popular apps had performance analysis done on them by highly experienced devs (might be an understatement LOL) such as yourself. It probably isn’t the best use of your time but maybe have it be a rotating task among the android dev team at google? Maybe a once a week performance tear down article on an app of the authors choice that they’re noticing lag on. It would also be cool to see a follow up posted by the app developer to see how much of an improvement these changes make.
Another excellent post, Romain. I’m have a question related to overdraw that seems relevant to this post: is it possible to have a view clear to a color other than black without overdraw? For example, I have a fully opaque view that I want to be solid green (or some other fully opaque color) when cleared. When setBackgroundColor is called, sure enough the view clears to green, but it also results in 1x overdraw. My View subclass has isOpaque return true and I’ve tried a couple of other things as well as doing a bit of research (found this post of yours: http://www.curious-creature.org/2009/03/04/speed-up-your-android-ui/ which is great at the app or activity level, but I need it only for a specific view) without success so far.
Just set your window’s background to green, either in onCreate() or better yet in your manifest’s theme.
One requirement I neglected to mention: the color needs to be dynamically set at runtime (i.e. there is a user pref setting for a color/theme, and the view background needs to change to reflect it)
Sorry about that… I misread your reply. Setting the window’s background color will probably be a solution for one of my use cases and I may just have to take the fps hit in the other. It would really be handy if this were something that could be done at the view level, but I understand if architecturally this isn’t possible.
We’re working on something but I cannot make any promise.
Hi Romain, I have the following problem with systrace. It never shows me something like “10440: m.jv.falcon.pro” in your example. It only shows me something like 128: or 30602: . I followed exactly your instructions. Do you know how I can identify, whats behind those numbers with three dots? I think it has to belong to my app but indicates nothing to identify.
Hey Romain,
Excellent writeup for Android-UI beginners! I followed the advice here and managed to get a red-on-green ListView activity to be blue-on-white and have very noticeable scrolling performance difference, especially testing on a G2.
Can you go into a bit more on what “Execute” does, because this is what I’m seeing even after all the optimizations: http://imgur.com/wItYc
Thanks!
“Nexus 7 offers another interesting advantage for performance analysis that we’ll talk about later.”
I must have missed the other interesting advantage ?
“Important: Hierarchy Viewer will only work on non-secure devices by default, such as engineering phones and tablets[…]”
Are Nexus phones/tablets engineering devices ? Or do we need root/custom rom ?
@Franck: The other advantage is explained in the standalone version of the article (link at the top.) I forgot to update this version. Nexus phones/tablets are *not* engineering devices. Your device is an engineering device if the build number contains the -eng or -userdebug tag instead of -user.
Hi Romain,
First off, thanks a ton for this article. I think this post alone just made tons of better Android developers, especially me. Thank you for this! I owe you a beer.
The OpenGL ES Trace Options panel seems to make the assumption that the activites reside in the same “package” as the application package name. This is often not the case for outsourced worked. For example “package name” (which is probably better called application name) could be com.bigcompany.android while the outsourcing company would put code here com.outsourcingRUs.bigcompany.projectX. Perhaps in the next release you could take a look into this. Adding a “launcher activity” in the application namespace which then launches the activity in the outsource namespace is a work around.
You can already do it. In the activity name fields just type the full activity name with its package and check the box underneath.
Oh gezz…I missed that. Thanks for pointing that out. Why I’m got ya here, I tried
“An easy way to figure out what’s going in during these gaps is to zoom in at the beginning of one them and click the largest colored block you can find. You can then follow the parent chain until you find something you recognize. In my case, I followed a call to Pattern.compileImpl, taking an average of 0.5 ms, all the way up to DBListAdapter.bindView.”
Would it be possible to elaborate on that a bit more? I tried that on my application from GLESCanvas.nDrawDisplayList, but I quickly end up at “Top Level” after a couple clicks on “parent” without recognizing anything.
Again, I can’t thank you enough for this article.
Josh, nDrawDisplayList() is the native code that processes the display lists and turns them into OpenGL commands. This is not where your application code runs. Look at getDisplayList() instead.
Regarding the availibility of hierarchy viewer for non-enginering devices :
* Android Debug Monitor has a “Dump View Hierarchy for UI Automator” functionnality and is able to get a view tree from my non engineering device : Is it something completly different or could hierarchy viewer use the same dump ?
* Could there be a switch to enable hiearchy viewer for a device in the developper menu of the device in a android 4.x ?
And thank you for your articles and presentations !
The dump for UI automator is a lot simpler and not as useful. There won’t be a switch on production devices because this is a potential security issue.
Thanks for the great article. Can I ask how much of the UI drawing operations are tranlated into OpenGL commands? Has this always been the case also? I have not seen this mentioned anywhere before!
I search for how to use the developer options “show GPU overdraw” in Google,and i feel so lucky to see the article.and i have one question:”does these tricks and tips useful on the early version (eg:platform Android2.2 , Android2.3)” .because they have not GPU hardware Accelerated.
Thanks for the great article. I have one question though while trying the “Overdraw” exercise. Is there a Windows alternative for the systrace.py script? Because I can’t get it to run (as many other people on Windows). I’m having the same issue with it as described here: http://stackoverflow.com/questions/11300773/error-running-systrace-tool-in-adb-using-a-jelly-bean-4-1-emulator-on-windows-7
Thanks, useful…
In my DDMS perspective, I can only see processes that I launch in debug mode.
I don’t see the regular apps I have on my device. Do I need to set something up?
Thanks.
Hi,
About “Remove Window Background” tips, you mentioned in GoogleI/O 2009 that it should be removed by defining an theme without window background, but in this article, you said that “Never set it to null unless your application is transparent.”. I am quite confused here. What’s the difference between “set it to null” and “onCreate() by calling getWindow().setBackgroundDrawable(null).”? Could you explain more? Thanks
I don’t need to do any of this nonsense on iOS. On my ancient iPhone 4 in my very first application I had thousands of list items with a complex item template consuming hundreds of megabytes of RAM. It scrolled fluidly at 60fps without any optimisation whatsoever other that writing clean code.
Hello, this is an nice article, I have go through your article and tried to check performance using ./adb shell command but I think I am getting something wrong. Here is my profile data in ms, please let me know what’s the problem. I have followed all the steps as per your instructuion.
com.ijoomer.src/com.ijoomer.src.IjoomerHomeActivity/android.view.ViewRootImpl@4157e638
com.ijoomer.src/com.ijoomer.components.icms.IcmsAllCategoryActivity/android.view.ViewRootImpl@41569dd0
com.ijoomer.src/com.ijoomer.components.icms.IcmsFeaturedArticlesActivity/android.view.ViewRootImpl@4161cef0
View hierarchy:
com.ijoomer.src/com.ijoomer.src.IjoomerHomeActivity/android.view.ViewRootImpl@4157e638
76 views, 0.00 kB of display lists
com.ijoomer.src/com.ijoomer.components.icms.IcmsAllCategoryActivity/android.view.ViewRootImpl@41569dd0
136 views, 0.00 kB of display lists
com.ijoomer.src/com.ijoomer.components.icms.IcmsFeaturedArticlesActivity/android.view.ViewRootImpl@4161cef0
60 views, 0.00 kB of display lists
Total ViewRootImpl: 3
Total Views: 272
Total DisplayList: 0.00 kB
Please reply me, thanks in advance.
Simply wish to say your article is as astounding. The clarity for your publish is simply excellent and i can think you are a professional on this subject. Fine along with your permission let me to seize your RSS feed to stay updated with forthcoming post. Thank you 1,000,000 and please continue the enjoyable work.
It’s a nice explanation. Thanks a lot.
Hi Roman, thank you for this post. I ran into an issue while trying to use this trick with 9-patch transparency you described. I am working on a small piano keyboard custom view. I have both white and black keys as a 9-patch drawable, I draw white keys and then black keys on Canvas. What I was trying to do is to make L-shaped 9-patch for white keys which is scaled uniformly (like a rectangle with a top-left corner removed https://www.dropbox.com/s/kfazmb5x1kgc26s/white_key.9.png). But it seems that 9-patch would not use this optimization when I overlap a stretch region. It only uses it if my stretch patches are only inside of a transparent or only inside of opaque regions. Is there any way I could achieve the desired effect and, if no, is it better to draw a key in two draws or leave overdraw (green) be?
Thanks Romain, I find myself returning from time to time to this posts and I seem to learn a new performance trick every time.
whoah this specific blog page is actually spectacular i enjoy looking through the articles you write. Continue the truly amazing function! You are aware of, a lot of people feel the need circular with this information and facts, you can encourage them to enormously.
A little bit of knowledge goes a long way in all situations in life.
Buying a car is no different! That means you need to read advice
from experts, as detailed below, to ensure that when you shop for that car, you
really know what you’re doing and how to get the best deal.