聚类算法之层次聚类
分级聚类就是一棵树
加入我们有如下一张图
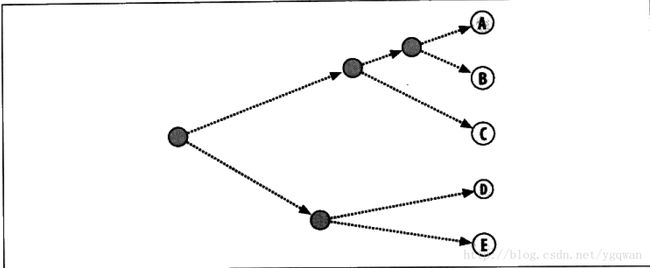
那么通过聚类之后形成一颗如下的树:
现在就分好了级,而且还能看出距离关系, 很明显ab之间的距离比de之间的距离要短
#coding:utf-8
import os
import sys
import chardet
from math import sqrt
from PIL import Image, ImageDraw
import random

def readFile(fileName):
    lines = [line for line in file(fileName)]
    colNames = lines[0].strip().split('\t')[1:]
    rowNames = []
    data = []
    for line in lines[1:]:
        p = line.strip().split('\t')
        rowNames.append(p[0])
        data.append([float(x) for x in p[1:]])
    return rowNames, colNames, data

def pearsonBeta(v1, v2):
    sum1 = sum(v1)
    sum2 = sum(v2)

    sum1Sq = sum([pow(v, 2) for v in v1])
    sum2Sq = sum([pow(v, 2) for v in v2])

    pSum = sum([v1[i] * v2[i] for i in range(len(v1))])

    nums = pSum - (sum1 * sum2 / len(v1))
    den = sqrt((sum1Sq - pow(sum1, 2) / len(v1)) * (sum2Sq - pow(sum2, 2) / len(v2)))
    if(den == 0):
        return 0
    return 1.0 - nums/den

#距离函数
def pearson(v1, v2):
    sum1 = sum(v1)
    sum2 = sum(v2)
    eSum1 = sum1 / len(v1)
    eSum2 = sum2 / len(v2)

    pSum = sum([(v1[i] - eSum1) * (v2[i] - eSum2) for i in range(len(v1))])
    pTmp1 = sqrt(sum([pow(v1[i] -eSum1, 2) for i in range(len(v1))]))
    pTmp2 = sqrt(sum([pow(v2[i] -eSum2, 2) for i in range(len(v2))]))
    pSqrtSum = pTmp1 * pTmp2

    if pSqrtSum == 0:
        return 0

    return 1 -  pSum / pSqrtSum

#距离函数2
def tanimoto(v1, v2):
    c1, c2, shr = 0, 0, 0
    for i in range(len(v1)):
        if v1[i] != 0: c1 += 1
        if v2[i] != 0: c2 += 1
        if v1[i] != 0 and v2[i] != 0: shr += 1
    return 1.0 - float(shr) / (float(c1 + c2 - shr))

class bicluster:
    def __init__(self, vec, left = None, right = None, distance = 0.0, id = None):
        self.vec = vec
        self.left = left
        self.right = right
        self.distance = distance
        self.id = id
    def vis(self):
        print self.vec
#层次聚类
def hCluster(rows, distanceFunc = pearson):
    distances = {}
    currentClustId = -1
    clust = [bicluster(rows[i], id = i) for i in range(len(rows))]

    while len(clust) > 1:
        lowestPair = (0, 1)
        closest = distanceFunc(clust[0].vec, clust[1].vec)
        for i in range(len(clust)):
            for j in range(i + 1, len(clust)):
                if(clust[i].id, clust[j].id) not in distances:
                    distances[(clust[i].id, clust[j].id)] = distanceFunc(clust[i].vec, clust[j].vec)

                d = distances[(clust[i].id, clust[j].id)]  #直接写成了i,j , 害我找了半天
                if d < closest:
                    closest = d
                    lowestPair = (i, j)
        mergevec = [(clust[lowestPair[0]].vec[i] + clust[lowestPair[1]].vec[i]) / 2.0 for i in range(len(clust[0].vec))]
        newCluster = bicluster(mergevec, left = clust[lowestPair[0]], right = clust[lowestPair[1]], distance = closest, id = currentClustId)

        currentClustId -= 1
        del clust[lowestPair[1]]   #must first del 1, then 0
        del clust[lowestPair[0]]
        clust.append(newCluster)
    return clust[0]


#k-均值聚类
def kcluster(rows, distanceFunc = pearson, k = 5):
    ranges = [(min(row[i] for row in rows), max(row[i] for row in rows)) for i in range(len(rows[0]))]

    clusters = [[random.random() * (ranges[i][1] - ranges[i][0]) + ranges[i][0] for i in range(len(rows[0]))] for j in range(k)]

    bestMatches = None
    for t in range(100):
        print "iter is: %d" %(t)
        lastMatches = [[] for i in range(k)]
        for i in range(len(rows)):
            row = rows[i]
            lastMatch = 0
            for j in range(k):
                d = distanceFunc(clusters[j], row)
                if d < distanceFunc(rows[lastMatch], row):
                    lastMatch = j
            lastMatches[lastMatch].append(i)

        if lastMatches == bestMatches:
            break;
        bestMatches = lastMatches

        #move center
        for i in range(k):
            if len(bestMatches[i]) > 0:
                newRow = []
                for j in range(len(rows[0])):
                    sum = 0
                    for v in range(len(bestMatches[i])):
                        sum += rows[v][j]
                    newRow.append(sum)
                for j in range(len(newRow)):
                    newRow[j] = newRow[j] / len(bestMatches[i])
                clusters[i] = newRow

    return bestMatches

#以缩进方式打印层次聚类的树
def printClust(clust, labels = None, n = 0):
    for i in range(n):print ' ',
    if clust.id < 0:
        print '-'
    else:
        if labels == None:
            print clust.id
        else:
            print labels[clust.id]
    if clust.left != None:
        printClust(clust.left, labels = labels, n = n + 1)
    if clust.right != None:
        printClust(clust.right, labels = labels, n = n + 1)


def getHeight(clust):
    if clust.left == None and clust.right == None:
        return 1
    return getHeight(clust.left) + getHeight(clust.right)

def getDepth(clust):
    if clust.left == None and clust.right == None:
        return 1
    return max(getDepth(clust.left), getDepth(clust.right)) + clust.distance

def drawnode(draw, clust, x, y, scaling, labels):
    if clust.id < 0:
        h1 = getHeight(clust.left) * 20
        h2 = getHeight(clust.right) * 20
        top = y - (h1 + h2) / 2
        bottom = y + (h1 + h2) / 2

        li = clust.distance * scaling
        draw.line((x, top + h1/2, x, bottom - h2/2), fill = (255, 0, 0))

        draw.line((x, top + h1/2, x + li, top + h1/2), fill = (255, 0, 0))
        draw.line((x ,bottom - h2/2, x + li, bottom - h2/2), fill = (255, 0, 0))

        drawnode(draw, clust.left, x + li, top + h1/2, scaling, labels)
        drawnode(draw, clust.right, x + li, bottom - h2/2, scaling, labels)
    else:
        draw.text((x + 5, y - 7), labels[clust.id], (0, 0, 0))


#以属性结构打印层次聚类的关系
def drawdendrogram(clust, labels, jpeg = "zebo2.jpg"):
    h = getHeight(clust) * 20
    w = 1200
    depth = getDepth(clust)

    scaling = float(w - 150) / depth

    img = Image.new("RGB", (w, h), (255, 255, 255))
    draw = ImageDraw.Draw(img)

    draw.line((0, h/2, 10, h/2), fill = (255, 0, 0))

    drawnode(draw, clust, 10, (h/2), scaling, labels)
    img.save(jpeg, "JPEG")


(wants, people, data) = readFile("F:\\py\\dataFetch\\julei\\data\\blogdata.txt")
clust = hCluster(data, distanceFunc = pearson)
printClust(clust, wants)
#drawdendrogram(clust, wants)
#print kcluster(data)
#cluster = hCluster(data, distanceFunc = tanimoto)
#drawdendrogram(cluster, rowNames)
那么执行这个程序之后生成如下一张图片:
本程序所需的数据是某某博客出现某某关键字的次数的一个矩阵, 不过现在官网的链接打不开了
附如下链接:http://pan.baidu.com/s/17SqJS
第一列是博客名, 后面的每一列都是单词在改博客出现的次数
