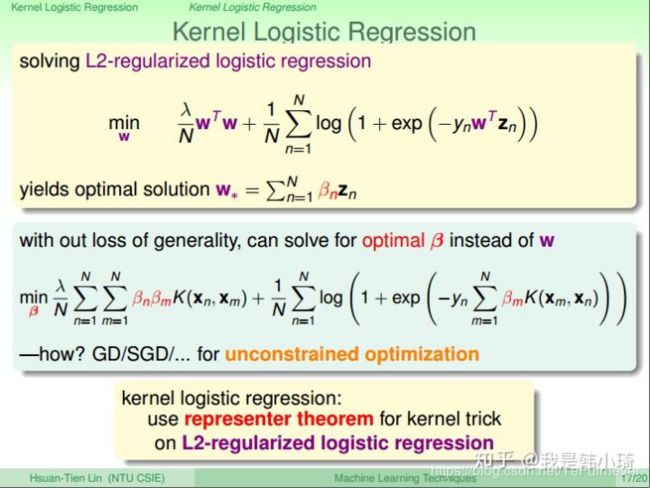
《机器学习》周志华西瓜书习题参考答案:第6章 - 支持向量机
【机器学习】《机器学习》周志华西瓜书 笔记/习题答案 总目录
- https://blog.csdn.net/TeFuirnever/article/details/96178919
——————————————————————————————————————————————————————
- 【机器学习】《机器学习》周志华西瓜书读书笔记:第6章 - 支持向量机
- 【机器学习】《机器学习实战》读书笔记及代码:第6章 - 支持向量机
习题
![]()
这个题在之前的课程笔记中讲过,链接:【机器学习】《机器学习》周志华西瓜书读书笔记:第6章 - 支持向量机

画了一个图,方便讲解。图中蓝色线即超平面,对应直线方程 w T x + b = 0 \mathbf{w}^T\mathbf{x}+b=0 wTx+b=0。投影向量 w \mathbf{w} w垂直于超平面,点 x x x 对应向量 x \mathbf{x} x,过点 x x x 作超平面的垂线,交点 x 0 x_0 x0 对应向量 x 0 \mathbf{x_0} x0。假设 由点 x 0 x_0 x0 指向点 x x x 的向量 为 r \mathbf{r} r,长度(也即点 x x x 与超平面的距离)为 r r r。
有两种方法计算可以计算出 r r r 的大小:
方法1:向量计算
由向量加法定义可得 x = x 0 + r \mathbf{x} = \mathbf{x_0} + \mathbf{r} x=x0+r
那么向量 r \mathbf{r} r 等于什么呢?它等于这个方向的单位向量乘上 r r r,也即有 r = w ∥ w ∥ ⋅ r \mathbf{r} = \frac{\mathbf{w}}{\Vert \mathbf{w} \Vert} \cdot r r=∥w∥w⋅r
因此又有 x = x 0 + w ∥ w ∥ ⋅ r \mathbf{x} = \mathbf{x_0} + \frac{\mathbf{w}}{\Vert \mathbf{w} \Vert} \cdot r x=x0+∥w∥w⋅r
由于点 x 0 x_0 x0 在超平面上,所以有 w T x 0 + b = 0 \mathbf{w}^T\mathbf{x_0}+b=0 wTx0+b=0
由 x = x 0 + w ∥ w ∥ ⋅ r \mathbf{x} = \mathbf{x_0} + \frac{\mathbf{w}}{\Vert \mathbf{w} \Vert} \cdot r x=x0+∥w∥w⋅r 可得 x 0 = x − w ∥ w ∥ ⋅ r \mathbf{x_0} = \mathbf{x} - \frac{\mathbf{w}}{\Vert \mathbf{w} \Vert} \cdot r x0=x−∥w∥w⋅r,代入直线方程消去 x 0 \mathbf{x_0} x0:
w T x 0 + b = w T ( x − w ∥ w ∥ ⋅ r ) + b = 0 \mathbf{w}^T\mathbf{x_0}+b = \mathbf{w}^T(\mathbf{x} - \frac{\mathbf{w}}{\Vert \mathbf{w} \Vert} \cdot r)+b = 0 wTx0+b=wT(x−∥w∥w⋅r)+b=0
简单变换即可得到:
r = w T x + b ∥ w ∥ r = \frac{\mathbf{w}^T\mathbf{x}+b}{\Vert \mathbf{w} \Vert} r=∥w∥wTx+b
又因为我们取距离为正值,所以要加上绝对值符号:
r = ∣ w T x + b ∣ ∥ w ∥ r = \frac{|\mathbf{w}^T\mathbf{x}+b|}{\Vert \mathbf{w} \Vert} r=∥w∥∣wTx+b∣
方法2:点到直线距离公式
假设直线方程为 a x 1 + b x 2 + c = 0 ax_1 + bx_2 + c= 0 ax1+bx2+c=0,那么有点到直线距离公式:
r = ∣ a x + b x 2 + c ∣ a 2 + b 2 r = \frac{|ax + bx_2 + c|}{\sqrt{a^2+b^2}} r=a2+b2∣ax+bx2+c∣
令 w = ( a , b ) \mathbf{w} = (a,b) w=(a,b), x = ( x 1 , x 2 ) \mathbf{x} = (x_1,x_2) x=(x1,x2),则可以把 a x 1 + b x 2 ax_1 + bx_2 ax1+bx2 写成向量形式 w T x \mathbf{w}^T\mathbf{x} wTx。把截距项设为 b b b,则直线方程变为 w T x + b = 0 \mathbf{w}^T\mathbf{x}+b=0 wTx+b=0,代入距离公式可得:
r = ∣ w T x + b ∣ w T w = ∣ w T x + b ∣ ∥ w ∥ r = \frac{|\mathbf{w}^T\mathbf{x}+b|}{\sqrt{\mathbf{w}^T\mathbf{w}}} = \frac{|\mathbf{w}^T\mathbf{x}+b|}{\Vert \mathbf{w} \Vert} r=wTw∣wTx+b∣=∥w∥∣wTx+b∣
该式扩展到多维情况下也是通用的。
这里没用使用 LIBSVM,用的 sklearn 中的sklearn.svm.svc(sklearn.svm.SVC()函数解析),它的实现也是基于 libsvm 的。
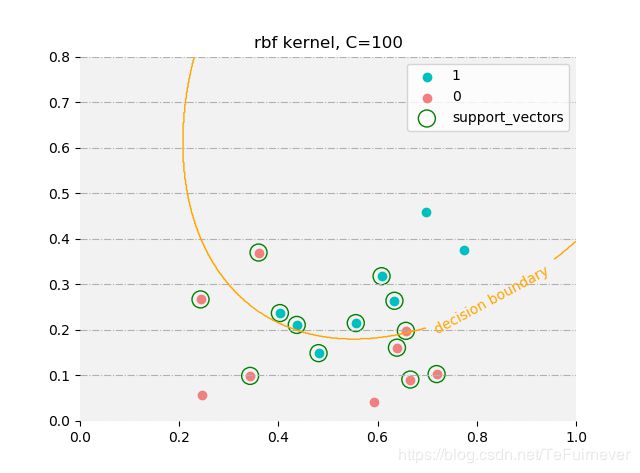
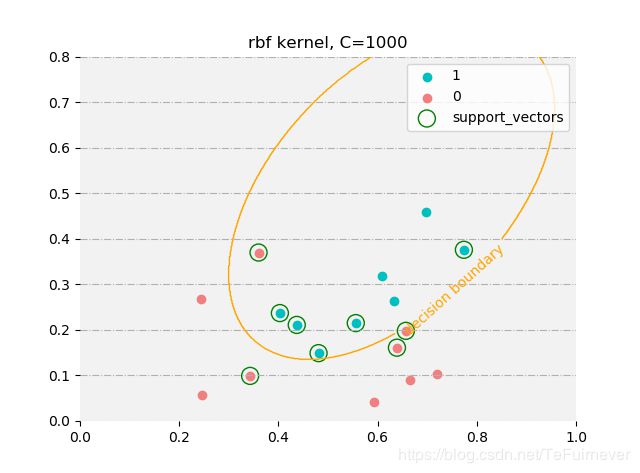
使用不同参数的时候,支持向量是不同的(没有对高斯核中的gamma调参)。
由于西瓜数据集3.0a线性不可分,所以使用线性核时,无论惩罚系数多高 ,还是会出现误分类的情况;而使用高斯核时在惩罚系数设置较大时,是可以完全拟合训练数据。所以在惩罚系数设置较小时,两者支持向量都类似,而在惩罚系数较大(支持向量机中,惩罚系数越大,正则化程度越低)时,高斯核的支持向量数目会较少,而线性核的会几乎没有变化。
代码在这里:
from sklearn import svm
import pandas as pd
from matplotlib import pyplot as plt
import numpy as np

def set_ax_gray(ax):
    ax.patch.set_facecolor("gray")        # 设置坐标轴的背景颜色
    ax.patch.set_alpha(0.1)               # 设置配色和透明度
    ax.spines['right'].set_color('none')  # 设置隐藏坐标轴
    ax.spines['top'].set_color('none')
    ax.spines['bottom'].set_color('none')
    ax.spines['left'].set_color('none')
    ax.grid(axis='y', linestyle='-.')

def plt_support_(clf, X_, y_, kernel, c):
    pos = y_ == 1
    neg = y_ == -1
    ax = plt.subplot()

    x_tmp = np.linspace(0, 1, 600)
    y_tmp = np.linspace(0, 0.8, 600)
    print(x_tmp.shape)
    print(y_tmp.shape)

    X_tmp, Y_tmp = np.meshgrid(x_tmp, y_tmp)
    print(X_tmp.shape)
    print(Y_tmp.shape)

    Z_rbf = clf.predict(np.c_[X_tmp.ravel(), Y_tmp.ravel()]).reshape(X_tmp.shape)
    print(Z_rbf.shape)

    # ax.contourf(X_, Y_, Z_rbf, alpha=0.75)
    cs = ax.contour(X_tmp, Y_tmp, Z_rbf, [0], colors='orange', linewidths=1)
    ax.clabel(cs, fmt={cs.levels[0]: 'decision boundary'})

    set_ax_gray(ax)

    ax.scatter(X_[pos, 0], X_[pos, 1], label='1', color='c')
    ax.scatter(X_[neg, 0], X_[neg, 1], label='0', color='lightcoral')

    ax.scatter(X_[clf.support_, 0], X_[clf.support_, 1], marker='o', c='', edgecolors='g', s=150,
               label='support_vectors')

    ax.legend()
    ax.set_title('{} kernel, C={}'.format(kernel, c))
    plt.show()

path = r'E:\DAIMA\MachineLearning_Zhouzhihua_ProblemSets-master\data\watermelon3_0a_Ch.txt'
data = pd.read_table(path, delimiter=' ', dtype=float)

X = data.iloc[:, [0, 1]].values
y = data.iloc[:, 2].values

y[y == 0] = -1

C = 100

clf_rbf = svm.SVC(C=C)
clf_rbf.fit(X, y.astype(int))
print('高斯核:')
print('预测值:', clf_rbf.predict(X))
print('真实值:', y.astype(int))
print('支持向量:', clf_rbf.support_)

print('-' * 40)

clf_linear = svm.SVC(C=C, kernel='linear')
clf_linear.fit(X, y.astype(int))
print('线性核:')
print('预测值:', clf_linear.predict(X))
print('真实值:', y.astype(int))
print('支持向量:', clf_linear.support_)

plt_support_(clf_rbf, X, y, 'rbf', C)

plt_support_(clf_linear, X, y, 'linear', C)
C = 100时训练情况如下:
高斯核:
预测值: [ 1  1  1  1  1  1 -1  1 -1 -1 -1 -1 -1  1  1 -1 -1]
真实值: [ 1  1  1  1  1  1  1  1 -1 -1 -1 -1 -1 -1 -1 -1 -1]
支持向量: [ 8  9 11 12 13 14 16  2  3  4  5  6  7]
线性核:
预测值: [ 1  1  1  1  1  1 -1  1 -1  1 -1 -1 -1 -1  1 -1 -1]
真实值: [ 1  1  1  1  1  1  1  1 -1 -1 -1 -1 -1 -1 -1 -1 -1]
支持向量: [ 8  9 11 12 13 14 16  2  3  4  5  6  7]
C = 10000时训练情况如下:
高斯核:
预测值: [ 1  1  1  1  1  1  1  1 -1 -1 -1 -1 -1 -1  1 -1 -1]
真实值: [ 1  1  1  1  1  1  1  1 -1 -1 -1 -1 -1 -1 -1 -1 -1]
支持向量: [11 12 13 14  1  4  5  6  7]
线性核:
预测值: [ 1  1  1  1  1  1 -1  1 -1  1 -1 -1 -1 -1  1 -1 -1]
真实值: [ 1  1  1  1  1  1  1  1 -1 -1 -1 -1 -1 -1 -1 -1 -1]
支持向量: [ 9 11 12 13 14 16  2  3  4  5  6  7]
代码在这里:
这里就只用sklearn中自带的iris数据集来对比题中几个算法。这里数据集不大,只有150个样本,所以就不拿出额外的样本作为测试集了,进行5-flod交叉验证,最后验证集的平均准确率作为评价模型标准。
- SVM将使用
sklearn.svm - BP神经网络将使用
Tensorflow实现 - 关于C4.5。Python中貌似没有C4.5的包,在第四章写的决策树代码也并不是严格的C4.5,为了方便这里就还是使用
sklearn吧。sklearn中决策树是优化的CART算法。
此外,各模型都进行了粗略的调参,不过在这里的notebook省略了。
1、导入相关包
import numpy as np
import pandas as pd

from sklearn import datasets
from sklearn.model_selection import KFold, train_test_split, cross_val_score, cross_validate
from sklearn import svm, tree

import tensorflow as tf
2、数据读入
iris = datasets.load_iris()
X = pd.DataFrame(iris['data'], columns=iris['feature_names'])

y = pd.Series(iris['target_names'][iris['target']])
# y = pd.get_dummies(y)
X.head()
3、模型对比
3.1 线性核SVM
linear_svm = svm.SVC(C=1, kernel='linear')
linear_scores = cross_validate(linear_svm, X, y, cv=5, scoring='accuracy')
linear_scores['test_score'].mean()
![]()
3.3 BP神经网络
这里BP神经网络使用tensorflow实现,其实在sklearn中也有(当然在第五章也用numpy实现过,也可以用),不过这里因为个人原因还是使用tensorflow。。不过事实上如果为了答这道题,使用sklearn其实代码量会更少。
tensorflow里面没有现成的交叉验证的api(tensorflow中虽然也有其他机器学习算法的api,但它主要还是针对深度学习的工具,训练一个深度学习模型常常需要大量的数据,这个时候做交叉验证成本太高,所以深度学习中通常不做交叉验证,这也为什么tensorflow没有cv的原因),这里使用 sklearn.model_selection.KFold实现BP神经网络的交叉验证。
# 定义模型,这里采用一层隐藏层的BP神经网络,神经元个数为16
x_input = tf.placeholder('float', shape=[None, 4])
y_input = tf.placeholder('float', shape=[None, 3])

keep_prob = tf.placeholder('float', name='keep_prob')

W1 = tf.get_variable('W1', [4, 16], initializer=tf.contrib.layers.xavier_initializer(seed=0))
b1 = tf.get_variable('b1', [16], initializer=tf.contrib.layers.xavier_initializer(seed=0))

h1 = tf.nn.relu(tf.matmul(x_input, W1) + b1)
h1_dropout = tf.nn.dropout(h1, keep_prob=keep_prob, name='h1_dropout')

W2 = tf.get_variable('W2', [16, 3], initializer=tf.contrib.layers.xavier_initializer(seed=0))
b2 = tf.get_variable('b2', [3], initializer=tf.contrib.layers.xavier_initializer(seed=0))

y_output = tf.matmul(h1_dropout, W2) + b2
# 定义训练步骤、准确率等
cost = tf.reduce_mean(tf.nn.softmax_cross_entropy_with_logits_v2(logits=y_output, labels=y_input))

train_step = tf.train.AdamOptimizer(0.003).minimize(cost)

correct_prediction = tf.equal(tf.argmax(y_output, 1), tf.argmax(y_input, 1))
accuracy = tf.reduce_mean(tf.cast(correct_prediction, 'float'))
# 将目标值one-hot编码
y_dummies = pd.get_dummies(y)
sess = tf.Session()
init = tf.global_variables_initializer()
costs = []
accuracys = []

for train, test in KFold(5, shuffle=True).split(X):
    sess.run(init)
    X_train = X.iloc[train, :]
    y_train = y_dummies.iloc[train, :]
    X_test = X.iloc[test, :]
    y_test = y_dummies.iloc[test, :]

    for i in range(1000):
        sess.run(train_step, feed_dict={x_input: X_train, y_input: y_train, keep_prob: 0.3})

    test_cost_, test_accuracy_ = sess.run([cost, accuracy],
                                          feed_dict={x_input: X_test, y_input: y_test, keep_prob: 1})
    accuracys.append(test_accuracy_)
    costs.append(test_cost_)
print(accuracys)
print(np.mean(accuracys))
3.4 CART
cart_tree = tree.DecisionTreeClassifier()
tree_scores = cross_validate(rbf_svm, X, y, cv=5, scoring='accuracy')
tree_scores
tree_scores['test_score'].mean()
4 总结
因为iris数据原因,本身容易区分,这四个模型最终结果来看几乎一致(除了自己拿tensorflow写的BP神经网络,验证集上的准确率低了0.02)
![]()
SVM 与 LDA 均可用于样本最优划分超平面的求解,即法向向量 ω ω ω ,参考文献——Comparing Linear Discriminant Analysis and Support Vector Machines中对 LDA 与 SVM 的本质描述,一般有:
![]()
考虑到线性核 SVM 的输入空间与特征空间相同,那么取相等时的条件是:

这说明两者生成的超平面相同,此时等效。
![]()
其实这个题目在p145的《休息一会儿》的注释里面已经给出答案了。
SVM 的确与神经网络有密切联系:若将隐层神经元数设置为训练样本数,且每个训练样本对应一个神经元中心,则以 高斯径向基函数为激活函数的RBF网络 恰与 高斯核SVM 的预测函数相同。
个人理解,两个模型还是有挺大差别的。
-
两种方法均采用径向基函数(RBF):
-
可以看出两者的表达式颇为相似,进一步分析,假设采用RBF网络作为一个二分类器,参考文献——Comparing Linear Discriminant Analysis and Support Vector Machines,两者分类函数对比如下:
![]()
SVM的决策边界(超平面)是由支持向量所确定的,即利用相对较少的数据特征来学得整个数据的特性。由于支持向量相对较少,若噪声样本出现在其上,容易对超平面的决策产生相对较大的影响,所以SVM对噪声敏感。
![]()
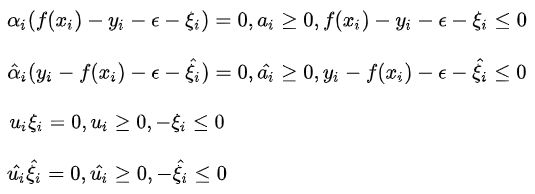
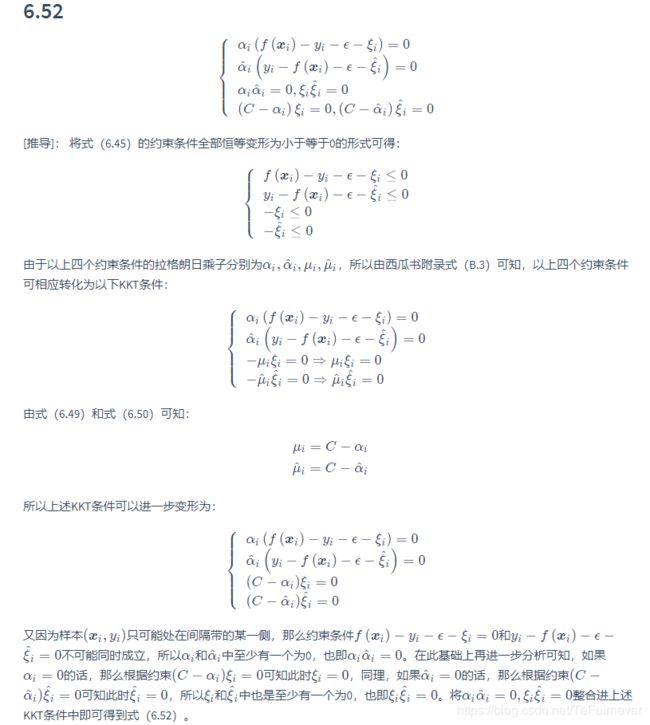
6.52式是经过将完整的KKT条件
![]()
完整的如下:
6.52证明过程如下:

这道题就简单看一下不同参数,训练结果的变换吧。

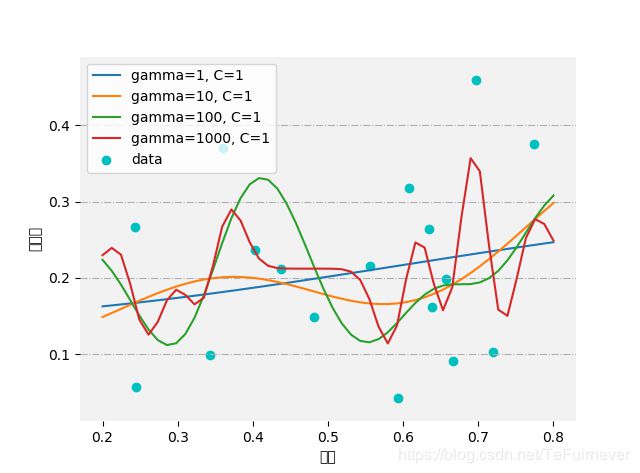
直观上看,含糖率和密度无明显关系。所以无论模型参数怎么调,看上去对数据的拟合都不是很好,预测值和真实值还是有较大差异。不过还是可以看出来随着gamma或者C的增大,模型都会趋于更加复杂。
这里代码很简单,还是放上来。
代码在这里:
import pandas as pd
from sklearn import svm
import matplotlib.pyplot as plt
import numpy as np

def set_ax_gray(ax):
    ax.patch.set_facecolor("gray")
    ax.patch.set_alpha(0.1)
    ax.spines['right'].set_color('none')  # 设置隐藏坐标轴
    ax.spines['top'].set_color('none')
    ax.spines['bottom'].set_color('none')
    ax.spines['left'].set_color('none')
    ax.grid(axis='y', linestyle='-.')

path = r'C:\Users\hanmi\Documents\xiguabook\watermelon3_0a_Ch.txt'
data = pd.read_table(path, delimiter=' ', dtype=float)

X = data.iloc[:, [0]].values
y = data.iloc[:, 1].values

gamma = 10
C = 1

ax = plt.subplot()
set_ax_gray(ax)
ax.scatter(X, y, color='C', label='data')

for gamma in [1, 10, 100, 1000]:
    svr = svm.SVR(kernel='rbf', gamma=gamma, C=C)
    svr.fit(X, y)

    ax.plot(np.linspace(0.2, 0.8), svr.predict(np.linspace(0.2, 0.8).reshape(-1, 1)),
            label='gamma={}, C={}'.format(gamma, C))
ax.legend(loc='upper left')
ax.set_xlabel('密度')
ax.set_ylabel('含糖率')

plt.show()

支持向量的规模与SVM计算速度息息相关,在不影响模型性能的情况下减少支持向量数目,能有效提高SVM效率。为此,一些稀松算法如 1-norm SVM, Lp-SVM, 自适应Lp-SVM 被提出,给出两篇参考文献如下:
- 支持向量机的缺陷及改进算法
- Support Vector Number Reduction: Survey and Experimental Evaluations
参考文章
- 机器学习(周志华)课后习题
- https://blog.csdn.net/snoopy_yuan/article/category/6788615

