机器学习实战(五)——Logistic回归
Logistic回归
S S 函数
σ(z)=11+e−z σ ( z ) = 1 1 + e − z
其中
z=w0x0+w1x1+w2x2+⋯+wnxn z = w 0 x 0 + w 1 x 1 + w 2 x 2 + ⋯ + w n x n
w w 为需求解的回归系数, x x 为特征。
写成向量形式:
z=[w0 w1 w2⋯wn]⎡⎣⎢⎢⎢⎢⎢⎢⎢x0x1x2⋮xn⎤⎦⎥⎥⎥⎥⎥⎥⎥=W×XT z = [ w 0 w 1 w 2 ⋯ w n ] [ x 0 x 1 x 2 ⋮ x n ] = W × X T
带入 S S 函数,即变为:
σ(z)=11+e−wTx σ ( z ) = 1 1 + e − w T x
则在二分类的问题中就有如下的假设:
P(y=1|x,w)=σw(x) P ( y = 1 | x , w ) = σ w ( x )
P(y=0|x,w)=1−σw(x) P ( y = 0 | x , w ) = 1 − σ w ( x )
将两式和在一起:
Cost(σw(x),y)=σw(x)y[1−σw(x)](1−y) C o s t ( σ w ( x ) , y ) = σ w ( x ) y [ 1 − σ w ( x ) ] ( 1 − y )
取对数有:
Cost(σw(x),y)=ylogσw(x)+(1−y)log(1−σw(x)) C o s t ( σ w ( x ) , y ) = y l o g σ w ( x ) + ( 1 − y ) l o g ( 1 − σ w ( x ) )
上式即为代价函数,通过上式就能求出给定样本为某一类别的概率。求解函数的最大值即为寻找最佳分类的过程。
假定特征之间相互独立,那么样本的概率就是特征概率的乘积,取对数之后就是相加:
J(w)=∑i=1n[yilogσw(xi)+(1−yi)logσw(xi)] J ( w ) = ∑ i = 1 n [ y i l o g σ w ( x i ) + ( 1 − y i ) l o g σ w ( x i ) ]
梯度上升算法
对于简单函数
f(x)=−x2+4x f ( x ) = − x 2 + 4 x
应用梯度上升算法求极值,一步一步逼近极值。数学表达如下:
xi+1=xi+α∂f(xi)xi x i + 1 = x i + α ∂ f ( x i ) x i
其中 α α 即为步长。
import matplotlib.pyplot as plt
def Gradient_Ascent_test():
    def f_partial(x_before):
        '''f(x)的偏导'''
        return -2 * x_before + 4
    x_before =  -1
    x_new = 0
    alpha = 0.01
    presision = 0.00000001
    pression = []
    while abs(x_new - x_before) > presision:
        x_before = x_new
        x_new = x_before + alpha * f_partial(x_before)
        pression.append(x_new)
    return pression
Gradient_Ascent_test()[-1]
1.999999515279857
显然,最后最大值在误差范围内接近真实值2。那么对于 J(w) J ( w ) 函数,同样可以如此获得最大值。接下来推导求系数 w w 的公式:
wj=wj+α∂J(w)wj w j = w j + α ∂ J ( w ) w j
代入 J(w) J ( w ) ,以及 σ(z) σ ( z ) 即可,接下来求 J(w) J ( w ) 的偏导:
∂J(w)wj=∂J(w)∂σ(wTx)⋅∂σ(wTx)∂wTx⋅∂wTxwj ∂ J ( w ) w j = ∂ J ( w ) ∂ σ ( w T x ) ⋅ ∂ σ ( w T x ) ∂ w T x ⋅ ∂ w T x w j
其中:
∂J(w)∂σ(wTx)=y1σ(wTx)+(y−1)11−σ(wTx) ∂ J ( w ) ∂ σ ( w T x ) = y 1 σ ( w T x ) + ( y − 1 ) 1 1 − σ ( w T x )
∂σ(wTx)∂wTx=σ(wTx)(1−σ(wTx)) ∂ σ ( w T x ) ∂ w T x = σ ( w T x ) ( 1 − σ ( w T x ) )
∂wTxwj=∂J(w1x1+w2x2+⋯+wnxn)∂wj=xj ∂ w T x w j = ∂ J ( w 1 x 1 + w 2 x 2 + ⋯ + w n x n ) ∂ w j = x j
综上:
∂J(w)wj=(y−σw(x))xj ∂ J ( w ) w j = ( y − σ w ( x ) ) x j
代入偏导, J(w) J ( w ) 的梯度上升公式即为:
wj=wj+α∑i=1n(yi−σw(xi))xij w j = w j + α ∑ i = 1 n ( y i − σ w ( x i ) ) x j i
算法测试
import numpy as np
def loadDataSet():
    dataMat = []; labelMat = []
    fr = open('testSet.txt')
    for line in fr.readlines():
        lineArr = line.strip().split()
        dataMat.append([1.0, float(lineArr[0]), float(lineArr[1])])
        labelMat.append(int(lineArr[2]))
    return dataMat,labelMat

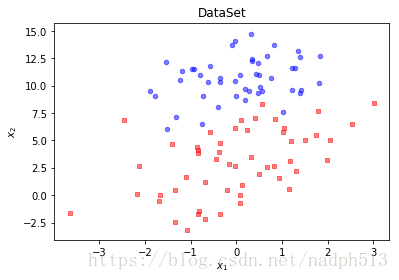
def plotDataSet():
    dataMat, labelMat = loadDataSet()
    dataArr = np.array(dataMat)
    n = np.shape(dataMat)[0]
    xcord1 = []; ycord1 = []
    xcord2 = []; ycord2 = []
    for i in range(n):
        if int(labelMat[i]) == 1:
            xcord1.append(dataArr[i,1]); ycord1.append(dataArr[i,2])
        else:
            xcord2.append(dataArr[i,1]); ycord2.append(dataArr[i,2])
    fig = plt.figure()
    ax = fig.add_subplot(111)
    ax.scatter(xcord1, ycord1, s = 20, c = 'red', marker = 's',alpha=.5)
    ax.scatter(xcord2, ycord2, s = 20, c = 'blue',alpha=.5)
    plt.title('DataSet')
    plt.xlabel('$x_1$'); plt.ylabel('$x_2$')
plt.show()plotDataSet()def sigmoid(x):
return 1.0 / (1 + np.exp(-x))
def grad_ascent(data, class_labels):
data_matrix = np.mat(data)
label_mat = np.mat(class_labels).T
m, n = np.shape(data_matrix)
alpha = 0.001
times = 500
weights = np.ones((n, 1))
for k in range(times):
z = sigmoid(data_matrix * weights)
error = label_mat - z
weights = weights + alpha * data_matrix.T * error
return weights.getA()data, label = loadDataSet()
weights = grad_ascent(data, label)
weightsarray([[ 4.12414349],
[ 0.48007329],
[-0.6168482 ]])
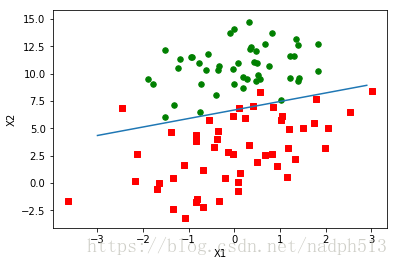
如上,已经算出回归系数 [w0,w1,w2] [ w 0 , w 1 , w 2 ]
def plotBestFit(weights):
    dataMat,labelMat=loadDataSet()
    dataArr = np.array(dataMat)
    n = np.shape(dataArr)[0]
    xcord1 = []; ycord1 = []
    xcord2 = []; ycord2 = []
    for i in range(n):
        if int(labelMat[i])== 1:
            xcord1.append(dataArr[i,1]); ycord1.append(dataArr[i,2])
        else:
            xcord2.append(dataArr[i,1]); ycord2.append(dataArr[i,2])
    fig = plt.figure()
    ax = fig.add_subplot(111)
    ax.scatter(xcord1, ycord1, s=30, c='red', marker='s')
    ax.scatter(xcord2, ycord2, s=30, c='green')
    x = np.arange(-3.0, 3.0, 0.1)
    y = (-weights[0]-weights[1]*x)/weights[2]
    ax.plot(x, y)
    plt.xlabel('X1'); plt.ylabel('X2');
plt.show()plotBestFit(weights)随机梯度上升
import random
def stocGradAscent1(dataMatrix, classLabels, numIter=150):
    m,n = np.shape(dataMatrix)
    weights = np.ones(n)
    for j in range(numIter):
        dataIndex = list(range(m))
        for i in range(m):
            alpha = 4/(1.0+j+i)+0.01
            randIndex = int(random.uniform(0,len(dataIndex)))
            h = sigmoid(sum(dataMatrix[randIndex]*weights))
            error = classLabels[randIndex] - h
            weights = weights + alpha * error * dataMatrix[randIndex]
            del(dataIndex[randIndex])
    return weights
dataMat, labelMat = loadDataSet()
weights = stocGradAscent1(np.array(dataMat), labelMat)
plotBestFit(weights)示例:从疝气病症状预测病马的死亡率
def colicTest():
    fr_train = open('horseColicTraining.txt')
    fr_test = open('horseColicTest.txt')
    training_set = []
    training_labels = []
    for line in fr_train.readlines():
        current = line.strip().split('\t')
        line_arr = []
        for i in range(len(current) - 1):
            line_arr.append(float(current[i]))
        training_set.append(line_arr)
        training_labels.append(float(current[-1]))
    train_weights = stocGradAscent1(np.array(training_set), training_labels, 500)
    error = 0
    test_vec = 0.0
    for line in fr_test.readlines():
        test_vec += 1
        current = line.strip().split('\t')
        line_arr = []
        for i in range(len(current) - 1):
            line_arr.append(float(current[i]))
        if int(classify_vector(np.array(line_arr), train_weights)) != int(current[-1]):
            error += 1
    error_rate = (float(error) / test_vec) * 100
    print("测试集错误率为: %.2f%%" % error_rate)
    return error_rate

def classify_vector(inx, weights):
    prob = sigmoid(sum(inx*weights))
    if prob > 0.5:
        return 1.0
    else:
        return 0.0

def multi_test():
    num_tests = 10
    error_sum = 0.0
    for k in range(num_tests):
        error_sum += colicTest()
print("平均错误率为", error_sum / float(num_tests), '%')multi_test()C:\ProgramData\Anaconda3\lib\site-packages\ipykernel_launcher.py:2: RuntimeWarning: overflow encountered in exp
测试集错误率为: 40.30%
测试集错误率为: 35.82%
测试集错误率为: 35.82%
测试集错误率为: 29.85%
测试集错误率为: 41.79%
测试集错误率为: 47.76%
测试集错误率为: 28.36%
测试集错误率为: 38.81%
测试集错误率为: 28.36%
测试集错误率为: 20.90%
平均错误率为 34.77611940298507 %


