机器学习实战(八)——回归
线性回归拟合直线
平方误差与最小二乘
∑i=1m(yi−xTiw)2 ∑ i = 1 m ( y i − x i T w ) 2
其中, yi y i 为真实值, xTiw x i T w 为预测值。用矩阵表示:
(y−Xw)T(y−Xw) ( y − X w ) T ( y − X w )
为求得 w w ,将上式求导:
XT(Y−Xw) X T ( Y − X w )
令其等于0,解出 w w :
w^=(XTX)−1XTy w ^ = ( X T X ) − 1 X T y
import numpy as np
import matplotlib.pyplot as plt

def loadDataSet(fileName):
    numFeat = len(open(fileName).readline().split('\t')) - 1
    xArr = []; yArr = []
    fr = open(fileName)
    for line in fr.readlines():
        lineArr =[]
        curLine = line.strip().split('\t')
        for i in range(numFeat):
            lineArr.append(float(curLine[i]))
        xArr.append(lineArr)
        yArr.append(float(curLine[-1]))
    return xArr, yArr

def show_data():
    xArr, yArr = loadDataSet('ex0.txt')
    n = len(xArr)
    xcord = []; ycord = []
    for i in range(n):
        xcord.append(xArr[i][1]); ycord.append(yArr[i])
    fig = plt.figure()
    ax = fig.add_subplot(111)
    ax.scatter(xcord, ycord, s = 20, c = 'blue',alpha = .5)
    plt.title('DataSet')
    plt.xlabel('X')
    plt.show()

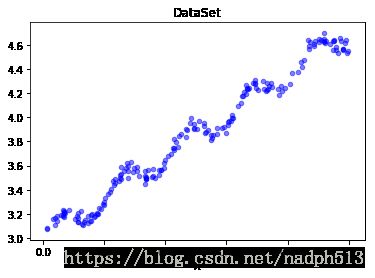
show_data()
def standRegres(xArr, yArr):
xMat = np.mat(xArr); yMat = np.mat(yArr).T
xTx = xMat.T * xMat
if np.linalg.det(xTx) == 0.0:
print("矩阵为奇异矩阵,不能求逆")
return
ws = xTx.I * (xMat.T*yMat)
return ws
def plotRegression():
xArr, yArr = loadDataSet('ex0.txt')
ws = standRegres(xArr, yArr)
xMat = np.mat(xArr)
yMat = np.mat(yArr)
xCopy = xMat.copy()
xCopy.sort(0)
yHat = xCopy * ws
fig = plt.figure()
ax = fig.add_subplot(111)
ax.plot(xCopy[:, 1], yHat, c = 'red')
ax.scatter(xMat[:,1].flatten().A[0], yMat.flatten().A[0], s = 20, c = 'blue',alpha = .5) #绘制样本点
plt.title('DataSet')
plt.xlabel('X')
plt.show()
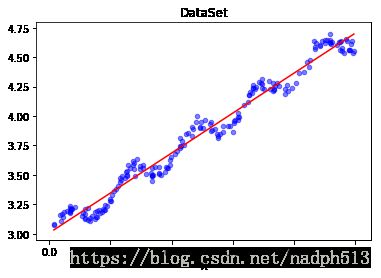
plotRegression()局部加权线性回归
权线性回归(Locally Weighted Linear Regression,LWLR)。在该方法中,我们给待预测点附近的每个点赋予一定的权重。与kNN一样,这种算法每次预测均需要事先选取出对应的数据子集。该算法解出回归系数W的形式如下:
w^=(XTWX)−1XTWy w ^ = ( X T W X ) − 1 X T W y
其中 W W 是一个矩阵,这个公式跟我们上面推导的公式的区别就在于 W W ,它用来给每个点赋予权重。
LWLR使用”核”(与支持向量机中的核类似)来对附近的点赋予更高的权重。核的类型可以自由选择,最常用的核就是高斯核,高斯核对应的权重如下:
w(i,i)=exp(|x(i)−x|−2k2) w ( i , i ) = e x p ( | x ( i ) − x | − 2 k 2 )
def lwlr(testPoint, xArr, yArr, k = 1.0):
    xMat = np.mat(xArr); yMat = np.mat(yArr).T
    m = np.shape(xMat)[0]
    weights = np.mat(np.eye((m)))
    for j in range(m):
        diffMat = testPoint - xMat[j, :]
        weights[j, j] = np.exp(diffMat * diffMat.T/(-2.0 * k**2))
    xTx = xMat.T * (weights * xMat)
    if np.linalg.det(xTx) == 0.0:
        print("矩阵为奇异矩阵,不能求逆")
        return
    ws = xTx.I * (xMat.T * (weights * yMat))
    return testPoint * ws

def lwlrTest(testArr, xArr, yArr, k=1.0):
    m = np.shape(testArr)[0]
    yHat = np.zeros(m)
    for i in range(m):
        yHat[i] = lwlr(testArr[i],xArr,yArr,k)
    return yHat

def plotlwlrRegression():
    xArr, yArr = loadDataSet('ex0.txt')
    yHat_1 = lwlrTest(xArr, xArr, yArr, 1.0)
    yHat_2 = lwlrTest(xArr, xArr, yArr, 0.01)
    yHat_3 = lwlrTest(xArr, xArr, yArr, 0.003)
    xMat = np.mat(xArr)
    yMat = np.mat(yArr)
    srtInd = xMat[:, 1].argsort(0)
    xSort = xMat[srtInd][:,0,:]
    fig, axs = plt.subplots(nrows=3, ncols=1,sharex=False, sharey=False, figsize=(10,8))
    axs[0].plot(xSort[:, 1], yHat_1[srtInd], c = 'red')
    axs[1].plot(xSort[:, 1], yHat_2[srtInd], c = 'red')
    axs[2].plot(xSort[:, 1], yHat_3[srtInd], c = 'red')
    axs[0].scatter(xMat[:,1].flatten().A[0], yMat.flatten().A[0], s = 20, c = 'blue', alpha = .5)
    axs[1].scatter(xMat[:,1].flatten().A[0], yMat.flatten().A[0], s = 20, c = 'blue', alpha = .5)
    axs[2].scatter(xMat[:,1].flatten().A[0], yMat.flatten().A[0], s = 20, c = 'blue', alpha = .5)

    axs0_title_text = axs[0].set_title('k=1.0')
    axs1_title_text = axs[1].set_title('k=0.01')
    axs2_title_text = axs[2].set_title(u'k=0.003')
    plt.setp(axs0_title_text, size=8, weight='bold', color='red')
    plt.setp(axs1_title_text, size=8, weight='bold', color='red')
    plt.setp(axs2_title_text, size=8, weight='bold', color='red')
    plt.xlabel('X')
    plt.show()

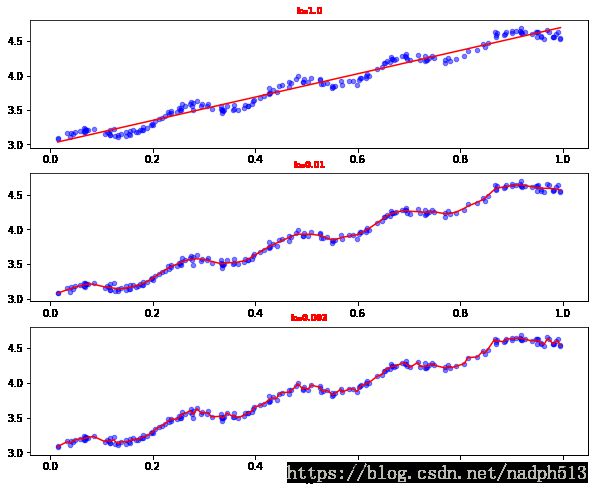
plotlwlrRegression()
缩减系数
如果数据的特征比样本点多, X X 为 m×n m × n 的矩阵,此时 m>n m > n , X X 为非满秩矩阵。因此,在求逆时会出错。因此,使用岭回归和lasso法缩减系数。
岭回归
岭回归就是在矩阵 XTX X T X 上加一个 λI λ I 从而使得矩阵非奇异,进而能对 XTX+λI X T X + λ I 求逆。其中 I I 是一个 m×m m × m 的单位阵。 λ λ 是自定的数值。在这种情况下,回归系数计算公式将变为:
w^=(XTX+λI)−1XTy w ^ = ( X T X + λ I ) − 1 X T y
def ridgeRegres(xMat, yMat, lam=0.2):
    xTx = xMat.T * xMat
    denom = xTx + np.eye(np.shape(xMat)[1]) * lam
    if np.linalg.det(denom) == 0.0:
        print("This mat is singular")
        return
    ws = denom.I * (xMat.T * yMat)
    return ws

def ridgeTest(xArr, yArr):
    xMat = np.mat(xArr);
    yMat = np.mat(yArr).T;
    yMean = np.mean(yMat, 0)
    yMat = yMat - yMean
    xMeans = np.mean(xMat, 0)
    xVar = np.var(xMat, 0)
    xMat = (xMat - xMeans) / xVar
    numTestPts = 30
    wMat = np.zeros((numTestPts, np.shape(xMat)[1]))
    for i in range(numTestPts):
        ws = ridgeRegres(xMat, yMat, np.exp(i - 10))
        wMat[i, :] = ws.T
    return wMat

abX, abY = loadDataSet('abalone.txt')
ridgeWeights = ridgeTest(abX, abY)
fig = plt.figure()
ax = fig.add_subplot(111)
ax.plot(ridgeWeights)
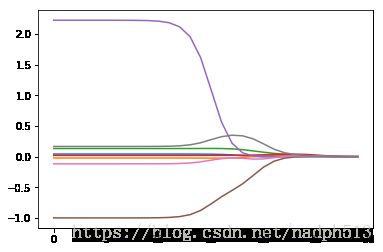
plt.show()lasso
lasso对回归系数做了限定,对应的约束条件如下:
∑k=1n|wk|≤λ ∑ k = 1 n | w k | ≤ λ
逐步向前回归
def stageWise(xArr,yArr,eps=0.01,numIt=100):
    xMat = np.mat(xArr); yMat=np.mat(yArr).T
    yMean = np.mean(yMat,0)
    yMat = yMat - yMean
    xMat = np.regularize(xMat)
    m,n=np.shape(xMat)
    returnMat = np.zeros((numIt,n)) #testing code remove
    ws = np.zeros((n,1)); wsTest = ws.copy(); wsMax = ws.copy()
    for i in range(numIt):
        print(ws.T)
        lowestError = inf;
        for j in range(n):
            for sign in [-1,1]:
                wsTest = ws.copy()
                wsTest[j] += eps*sign
                yTest = xMat*wsTest
                rssE = rssError(yMat.A,yTest.A)
                if rssE < lowestError:
                    lowestError = rssE
                    wsMax = wsTest
        ws = wsMax.copy()
        returnMat[i,:]=ws.T
    return returnMat

stageWise(xArr, yArr, 0.01, 200)


