R语言数据分析、展现与实例(06)
热力图
> sales <- read.csv("sales.csv")
> sales
   Month London NewYork Tokyo Paris
1    Jan   5064    3388  7074  8701
2    Feb   6115    4459  4603  8249
3    Mar   5305    5091  4787  8560
4    Apr   3185    4015  6214  7144
5    May   4182    4864  4700  8645
6    Jun   5816    4333  4592 10172
7    Jul   5947    4895  5719  5337
8    Aug   4049    4520  4219 11076
9    Sep   4003    3649  5079 10026
10   Oct   4937    3986  4499  7556
11   Nov   3470    3551  4540  8539
12   Dec   5915    3514  5658  7812
> rownames(sales) <- sales[,1]
> sales
    Month London NewYork Tokyo Paris
Jan   Jan   5064    3388  7074  8701
Feb   Feb   6115    4459  4603  8249
Mar   Mar   5305    5091  4787  8560
Apr   Apr   3185    4015  6214  7144
May   May   4182    4864  4700  8645
Jun   Jun   5816    4333  4592 10172
Jul   Jul   5947    4895  5719  5337
Aug   Aug   4049    4520  4219 11076
Sep   Sep   4003    3649  5079 10026
Oct   Oct   4937    3986  4499  7556
Nov   Nov   3470    3551  4540  8539
Dec   Dec   5915    3514  5658  7812
> library(RColorBrewer)
> sales <- sales[,-1]
> sales
    London NewYork Tokyo Paris
Jan   5064    3388  7074  8701
Feb   6115    4459  4603  8249
Mar   5305    5091  4787  8560
Apr   3185    4015  6214  7144
May   4182    4864  4700  8645
Jun   5816    4333  4592 10172
Jul   5947    4895  5719  5337
Aug   4049    4520  4219 11076
Sep   4003    3649  5079 10026
Oct   4937    3986  4499  7556
Nov   3470    3551  4540  8539
Dec   5915    3514  5658  7812
> data_matrix <- data.matrix(sales)         #将sales转换为matrix数据类型
> class(sales)
[1] "data.frame"
> is.matrix(sales)
[1] FALSE
> class(data_matrix)
[1] "matrix"
> pal=brewer.pal(7,"YlOrRd")
> pal
[1] "#FFFFB2" "#FED976" "#FEB24C" "#FD8D3C" "#FC4E2A" "#E31A1C" "#B10026"
> breaks <- seq(3000,12000,1500)          #产生一个从3000到12000每隔1500分隔的向量
> breaks
[1]  3000  4500  6000  7500  9000 10500 12000
> layout(matrix(data=c(1,2),nrow=1,ncol=2),widths = c(8,1),
+ heights=c(1,1))
> #Set margins for the heatmap
> par(mar = c(5,10,4,2),oma=c(0.2,0.2,0.2,0.2),mex=0.5)
> image(x=1:nrow(data_matrix),y=1:ncol(data_matrix),
+       z=data_matrix,axes=FALSE,xlab="Month",
+       ylab="",col=pal[1:length(breaks)-1],
+       breaks=breaks,main="Sales Heat Map")
> axis(1,at=1:nrow(data_matrix),labels=rownames(data_matrix),col="white",las=1)
> axis(2,at=1:ncol(data_matrix),labels=colnames(data_matrix),
+ col="white",las=1)
> abline(h=c(1:ncol(data_matrix))+0.5,
+ v=c(1:nrow(data_matrix))+0.5,col="white",lwd=2,xpd=FALSE)
breaks2<-breaks[-length(breaks)]> par(mar = c(5,1,4,7))
> image(x=1,y=0:length(breaks2),z=t(matrix(breaks2))*1.001,
+ col=pal[1:length(breaks)-1],axes=FALSE,breaks=breaks,xlab="",ylab="",xaxt="n")
> axis(4,at=0:(length(breaks2)-1),labels=breaks2,col="white",las=1)
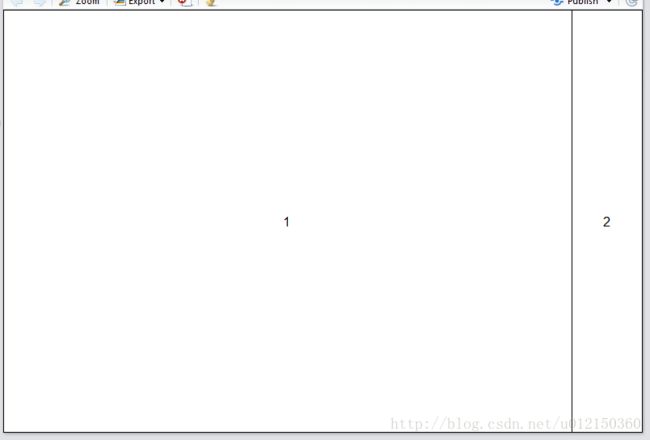
> abline(h=c(1:length(breaks)),col="white",lwd=2,xpd=F)将layout的效果显示出来
> xx <- layout(matrix(data=c(1,2),nrow=1,ncol=2),widths = c(8,1),
+ heights=c(1,1))
> layout.show(xx)
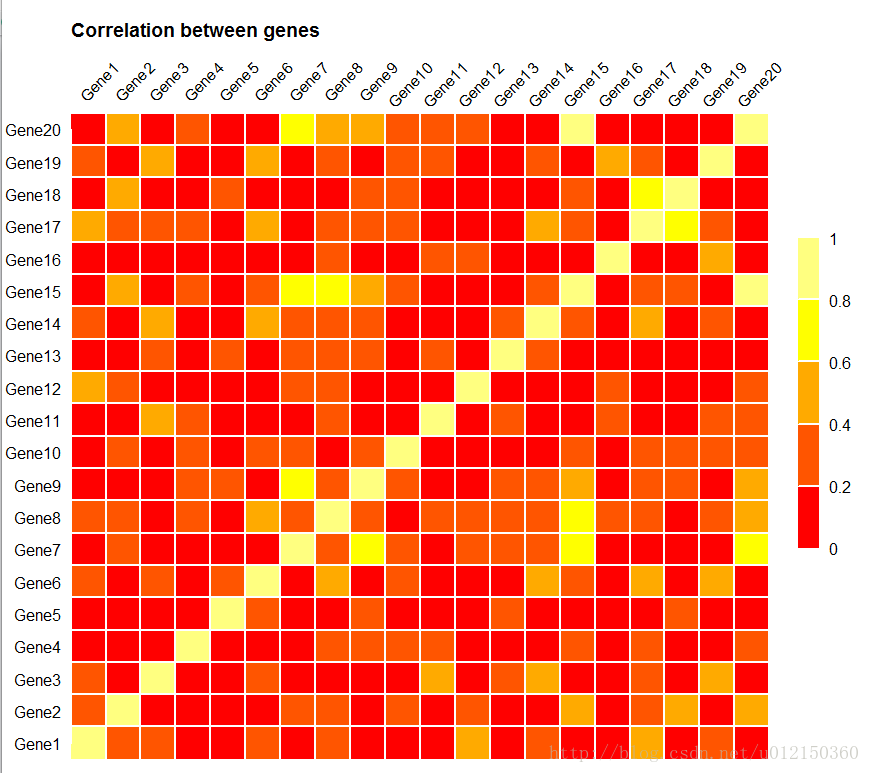
相关热力图
> genes <- read.csv("genes.csv")
> rownames(genes) <- colnames(genes)
> data_matrix <- data.matrix(genes)
> pal = heat.colors(5)
> breaks <- seq(0,1,0.2)
> layout(matrix(data=c(1,2), nrow=1, ncol=2), widths=c(8,1),
+        heights=c(1,1))
> par(mar = c(3,7,12,2),oma=c(0.2,0.2,0.2,0.2),mex=0.5)
> image(x=1:nrow(data_matrix),y=1:ncol(data_matrix),
+ z=data_matrix,xlab="",ylab="",breaks=breaks,
+ col=pal,axes=FALSE)
> text(x=1:nrow(data_matrix)+0.75, y=par("usr")[4] + 1.5,
+      srt = 45, adj = 1, labels = rownames(data_matrix),   #str为字体的角度,
+      xpd = TRUE)
> axis(2,at=1:ncol(data_matrix),labels=colnames(data_matrix),
+      col="white",las=1)
> abline(h=c(1:ncol(data_matrix))+0.5,v=c(1:nrow(data_matrix))+0.5,
+        col="white",lwd=2,xpd=F)
> title("Correlation between genes",line=8,adj=0)
> breaks2<-breaks[-length(breaks)]
# Color Scale
> par(mar = c(25,1,25,7))
> image(x=1, y=0:length(breaks2),z=t(matrix(breaks2))*1.001,
+       col=pal[1:length(breaks)-1],axes=FALSE,
+       breaks=breaks,xlab="",ylab="",
+ xaxt="n")
> axis(4,at=0:(length(breaks2)),labels=breaks,col="white",las=1)
> abline(h=c(1:length(breaks2)),col="white",lwd=2,xpd=F)
展现多变量数据
library(RColorBrewer)
nba <- read.csv("nba.csv")
rownames(nba)<-nba[,1]
data_matrix<-t(scale(data.matrix(nba[,-1])))
pal=brewer.pal(6,"Blues")
statnames<-c("Games Played", "Minutes Played", "Total Points",
"Field Goals Made", "Field Goals Attempted",
"Field Goal Percentage", "Free Throws Made",
"Free Throws Attempted", "Free Throw Percentage",
"Three Pointers Made", "Three Pointers Attempted",
"Three Point Percentage", "Offensive Rebounds",
"Defensive Rebounds", "Total Rebounds", "Assists", "Steals",
"Blocks", "Turnovers", "Fouls")
par(mar = c(3,14,19,2),oma=c(0.2,0.2,0.2,0.2),mex=0.5)
#Heat map
image(x=1:nrow(data_matrix),y=1:ncol(data_matrix),
z=data_matrix,xlab="",ylab="",col=pal,axes=FALSE)
#X axis labels
text(1:nrow(data_matrix), par("usr")[4] + 1,
srt = 45, adj = 0,labels = statnames,
xpd = TRUE, cex=0.85)
#Y axis labels
axis(side=2,at=1:ncol(data_matrix),
labels=colnames(data_matrix),
col="white",las=1, cex.axis=0.85)
#White separating lines
abline(h=c(1:ncol(data_matrix))+0.5,
v=c(1:nrow(data_matrix))+0.5,
col="white",lwd=1,xpd=F)
#Graph Title
text(par("usr")[1]+5, par("usr")[4] + 12,
"NBA per game performance of top 50corers",
xpd=TRUE,font=2,cex=1.5)
使用chron包进行日历形式展示
library("chron")
source("calendarHeat.R")
stock.data <- read.csv("google.csv")
calendarHeat(dates=stock.data$Date,
values=stock.data$Adj.Close,
varname="Google Adjusted Close")
等高线图
> contour(x=10*1:nrow(volcano),y=10*1:ncol(volcano),z=volcano,
+         xlab="Metres West",ylab="Metres North",main="Topography of Maunga Whau Volcano")
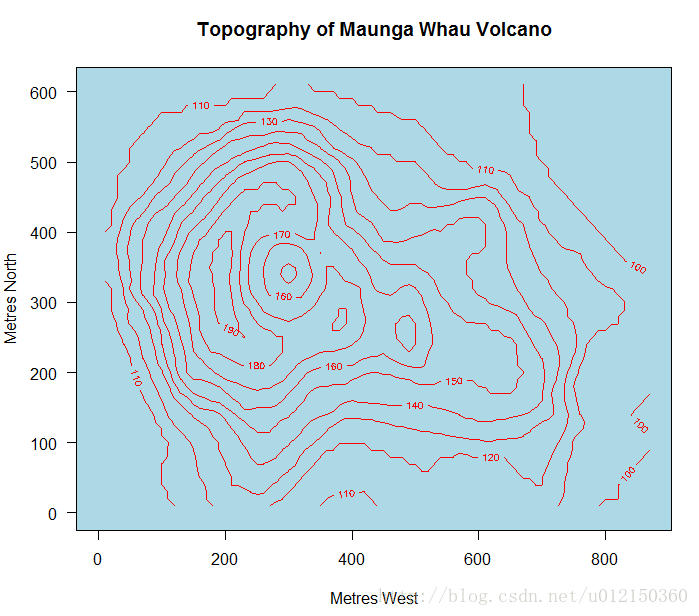
润色等高线图
> par(las=1)   #las表示刻度上的值永远是水平的
> plot(0,0,xlim=c(0,10*nrow(volcano)),ylim=c(0,10*ncol(volcano)),
+ type="n",xlab="Metres West",
+ ylab="Metres North",main="Topography of Maunga Whau Volcano")
> u<- par("usr")       #得到图形对角线的坐标(x1, x2, y1, y2)
> rect(u[1],u[3],u[2],u[4],col="lightblue")
> contour(x=10*1:nrow(volcano),y=10*1:ncol(volcano),volcano,col="red",add=TRUE)  #add表示在原来的图上加,并不另起一张图
等高线图填充颜色
> filled.contour(x=10*1:nrow(volcano),y=10*1:ncol(volcano),z=volcano,
+ color.palette=terrain.colors,     #自动产生阶梯颜色
+ plot.title=title(main="The Topography of Maunga Whau",
+ xlab="Meters North",ylab="Meters West"),
+ plot.axes= {axis(1,seq(100,800,by=100))
+ axis(2,seq(100,600,by=100))},
+ key.title= title(main="Height\n(meters)"),
+ key.axes=axis(4,seq(90,190,by=10)))
利用rgl包制作三维曲面图
> library(rgl)
> z <- 2*volcano
> x<- 10*(1:nrow(z))
> y<- 10*(1:ncol(z))
> zlim<- range(z)
> zlen <- zlim[2]-zlim[1]+1
> colorlut <- terrain.colors(zlen)
> col <- colorlut[z-zlim[1]+1]
> rgl.open()
> rgl.surface(x,y,z,color=col,back="lines")
利用maps包画出地图
美国每个州的谋杀率:
library(maps)
library(RColorBrewer)
> x<-map("state",plot=FALSE)
> class(x)
[1] "map"
> for(i in 1:length(row.names(USArrests))){
+ for(j in 1:length(x$names)){
+ if(grepl(rownames(USArrests)[i],x$names[j],ignore.case = T)) #grepl为字符串匹配函数,ignore.case=T表示忽略大小写
+ x$measure[j] <- as.double(USArrests$Murder[i])   #赋值
+ }
+ }
> color <-brewer.pal(7,"Reds")
> sd <- data.frame(col=color,
+ values =seq(min(x$measure[!is.na(x$measure)]),
+ max(x$measure[!is.na(x$measure)])*1.0001,
+ length.out=7))
> breaks <- sd$values
> breaks
[1]  0.800000  3.566957  6.333913  9.100870 11.867827 14.634783 17.401740
> matchcol <- function(y){
+ as.character(sd$col[findInterval(y,sd$values)])
+ }
> layout(matrix(data=c(2,1),nrow=1,ncol=2),
+ width=c(8,1),heights=c(8,1))
> par(mar=c(20,1,20,7),oma=c(0.2,0.2,0.2,0.2),mex=0.5)
> image(x=1, y=0:length(breaks),z=t(matrix(breaks))*1.001,
+       col=color[1:length(breaks)-1],axes=FALSE,breaks=breaks,
+ xlab="", ylab="", xaxt="n")
> axis(4,at=0:(length(breaks)-1),
+ labels=round(breaks),col="white",las=1)
> abline(h=c(1:length(breaks)),col="white",lwd=2,xpd=F)
> map("state",boundary = FALSE,col=matchcol(x$measure),
+ fill=TRUE,lty="blank")
> map("state",col="white",add=TRUE)  #画各州分界线
> title("Murder Rates by US State in 1973 \n
+ (arrests per 100,000 residents)", line=2)
纽约
> library(maps)
> map("county","new york")
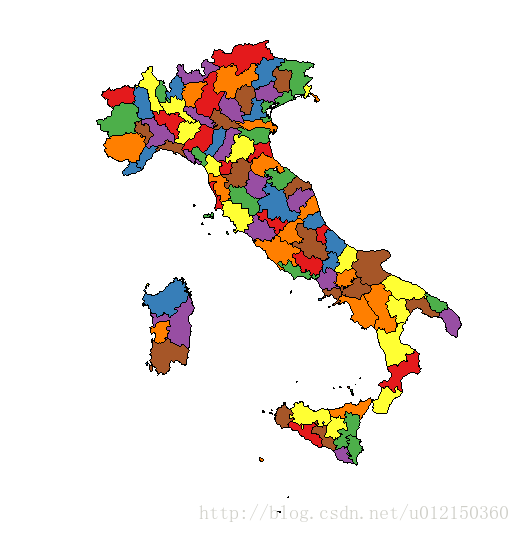
意大利
> library(RColorBrewer)
> map("italy",fill=TRUE,col=brewer.pal(7,"Set1"))
利用sp包画降雨量图
ps:不知为何此网址中的数据我load不进来……大家有知道原因的可告知,谢谢
library(sp)
load(url("http://gadm.org/data/rda/FRA_adm1.RData"))
gadm$rainfall<-rnorm(length(gadm$NAME_1),mean=50,sd=15)
spplot(gadm,"rainfall",
col.regions =rev(terrain.colors(gadm$rainfall)),
main="Rainfall (simulated) in French administrative regions")
使用google地图包RgoogleMaps
> library(rgdal)
> library(RgoogleMaps)
> air <- read.csv("londonair.csv")
> london<-GetMap(center=c(51.51,-0.116), #地图的中心经纬度
 zoom =10, destfile = "London.png",maptype = "mobile") #zoom为放大级别,中间产生图片的名字,地图类型
> PlotOnStaticMap(london,lat = air$lat, lon = air$lon,  #画图
 cex=2,pch=19,col=as.character(air$color))  #标注点的形状,大小,颜色
卫星地图
london<-GetMap(center=c(51.51,-0.116),zoom =13,
destfile ="London_satellite.png",maptype = "satellite")  #将地图类型设为卫星图
PlotOnStaticMap(london,lat =air$lat, lon = air$lon,
cex=2,pch=19,col=as.character(air$color))
把地图直接输出到图像文件
> GetMap(center=c(40.714728,-73.99867), zoom =14,
+        destfile = "Manhattan.png",maptype = "hybrid"); #将得到的图片直接保存到工作目录下叫Manhattan.png的文件;地图类型为混合型,既有卫星地图又有数据
高精度输出图像文件
不知道这个为什么不行……大神看到求解答
> GetOsmMap(lonR= c(-74.67102, -74.63943),
+           latR = c(40.33804,40.3556),scale = 7500,
+           destfile = "PrincetonOSM.png")
[1] "http://tile.openstreetmap.org/cgi-bin/export?bbox=-74.67102,40.33804,-74.63943,40.3556&scale=7500&format=png"
trying URL 'http://tile.openstreetmap.org/cgi-bin/export?bbox=-74.67102,40.33804,-74.63943,40.3556&scale=7500&format=png'
Error in download.file(url, destfile, mode = "wb", quiet = FALSE) :
  cannot open URL 'http://tile.openstreetmap.org/cgi-bin/export?bbox=-74.67102,40.33804,-74.63943,40.3556&scale=7500&format=png'
In addition: Warning message:
In download.file(url, destfile, mode = "wb", quiet = FALSE) :
  cannot open URL 'http://tile.openstreetmap.org/cgi-bin/export?bbox=-74.67102,40.33804,-74.63943,40.3556&scale=7500&format=png': HTTP status was '400 Bad Request'
KML数据
- Google’s Keyhole Markup Language (KML) format
> writeOGR(cities,"cities.kml","cities",driver = "KML") #将kml文件存储在工作目录下
> df <- readOGR("cities.kml","cities")  #将上面取得的值赋给df
OGR data source with driver: KML
Source: "cities.kml", layer: "cities"
with 606 features
It has 2 fields
> df    #查看
ESRI文件
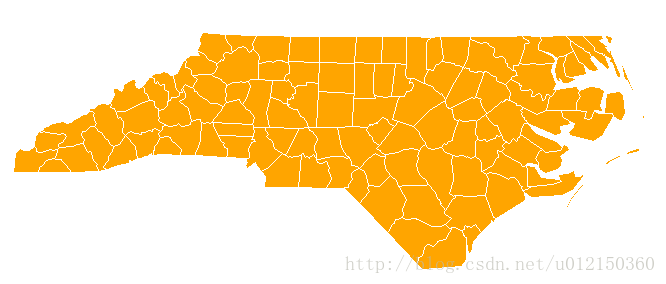
> library(maptools)

> sfdata <- readShapeSpatial(system.file("shapes/sids.shp",package="maptools")[1],proj4string =CRS("+proj=longlat"))

> class(sfdata)
[1] "SpatialPolygonsDataFrame"
attr(,"package")
[1] "sp"

> plot(sfdata,col="orange",border="white",axes=TRUE)
shapefiles 包
> library(shapefiles)
> sf<-system.file("shapes/sids.shp", package="maptools")[1]  #得到sids文件的地址
> sf
[1] "D:/R_library/maptools/shapes/sids.shp"
> sf<-substr(sf,1,nchar(sf)-4)   #将以上地址的最后几位字符去除,以防以下sfdata无法判别文件名
> sf
[1] "D:/R_library/maptools/shapes/sids"
> sfdata <- read.shapefile(sf)
> write.shapefile(sfdata, "newsf")  #将sfdata存为文件,文件名为newsf
> class(sfdata)
[1] "list"
输出图像文件的一般用法
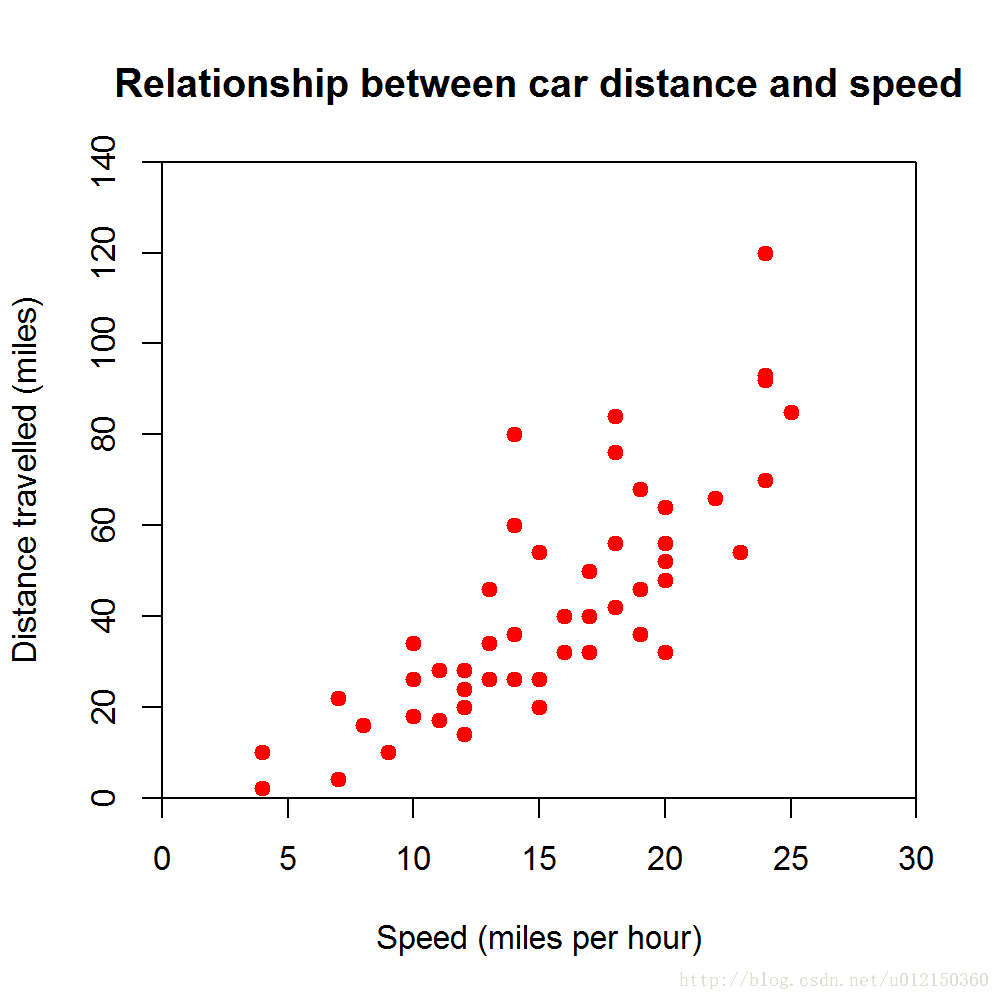
> png("cars.png",res=200,height=1000,width=1000) #定义图片的路径、名字,像素点(res)的个数,高度和宽度
> plot(cars$dist~cars$speed,
+ main = "Relationship between car distance and speed",
+ xlab="Speed (miles per hour)",ylab="Distance travelled (miles)",
+ xlim=c(0,30),ylim=c(0,140),
+ xaxs="i",yaxs="i",col="red",pch=19)
> dev.off()  #关闭设备
RStudioGD
        2
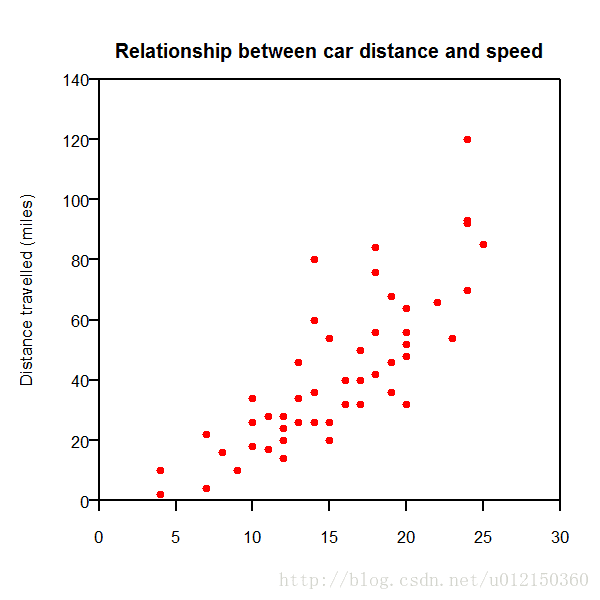
提高精度
> png("cars.png",res=200,height=600,width=600)
> par(mar=c(4,4,3,1),omi=c(0.1,0.1,0.1,0.1),mgp=c(3,0.5,0),
+     las=1,mex=0.5,cex.main=0.6,cex.lab=0.5,cex.axis=0.5)
> plot(cars$dist~cars$speed,
+      main="Relationship between car distance and speed",
+      xlab="Speed (miles per hour)",ylab="Distance travelled (miles)",
+      xlim=c(0,30),ylim=c(0,140),
+      xaxs="i",yaxs="i",
+      col="red",pch=19,cex=0.5)
> dev.off()
RStudioGD
        2
>
保存矢量格式文件到pdf文件
> pdf("cars.pdf")  #矢量文件没有分辨率
> plot(cars$dist~cars$speed,
+      main="Relationship between car distance and speed",
+      xlab="Speed (miles per hour)",ylab="Distance travelled (miles)",
+      xlim=c(0,30),ylim=c(0,140),
+      xaxs="i",yaxs="i",
+      col="red",pch=19,cex=0.5)
> dev.off()
RStudioGD
svg文件,ps文件
svg("3067_10_03.svg")
#plot command here
dev.off()
postscript("3067_10_03.ps")
#plot command here
dev.off()
在一个pdf文件中输出多张图
pdf("multiple.pdf")
for(i in 1:3)
plot(cars,pch=19,col=i)
dev.off()改变色彩模式
> pdf("multiple.pdf",colormodel="cmyk")  #将色彩模式从RGB改为cmyk
> for(i in 1:3)
+     plot(cars,pch=19,col=i)
> dev.off()
null device
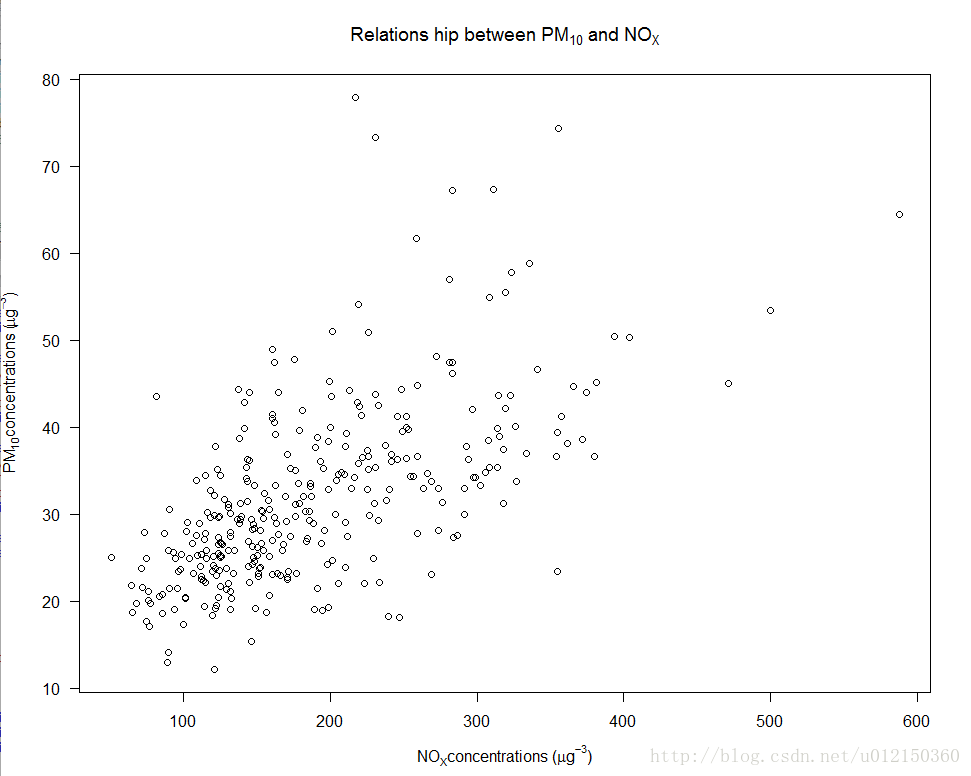
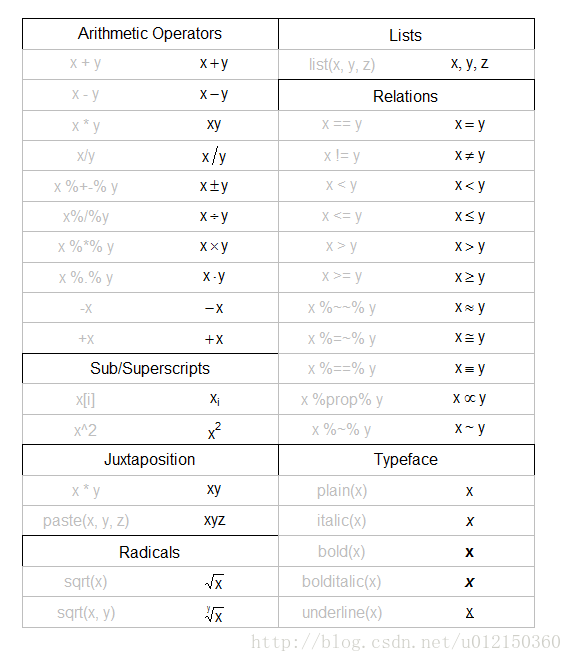
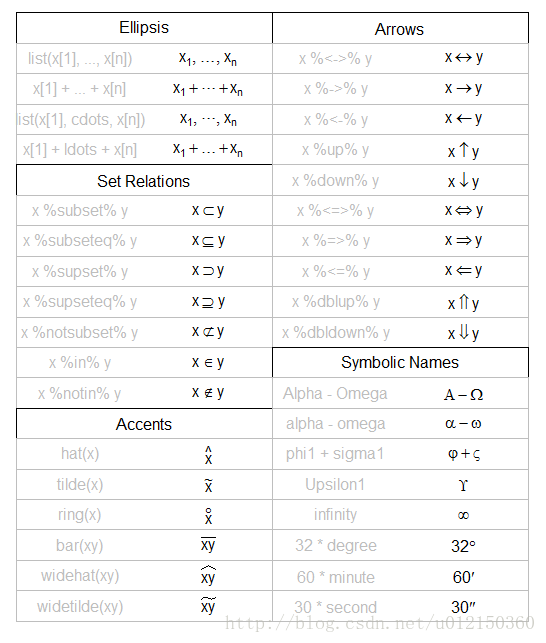
1 在输出中表现数学公式
> plot(air,las=1,
+      main=expression(paste("Relations hip between ",PM[10]," and ",NO[X])),
+      xlab=expression(paste(NO[X],"concentrations (",mu*g^-3,")")),
+      ylab=expression(paste(PM[10],"concentrations (",mu*g^-3,")")))
公式表达
demo(plotmath)例子
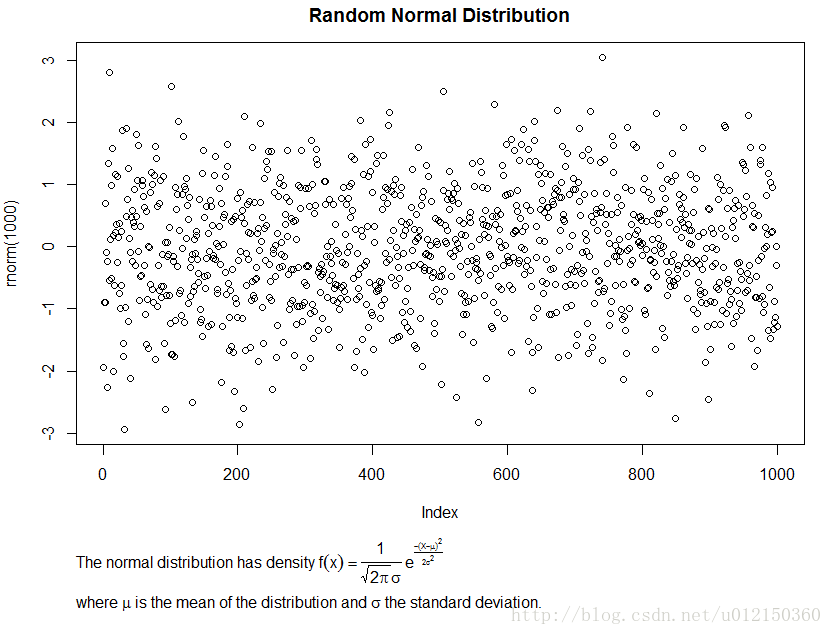
> plot(rnorm(1000),main="Random Normal Distribution")
> desc <- expression(paste("The normal distribution has density ",f(x)==frac(1,sqrt(2*pi)*sigma)~plain(e)^frac(-(X-mu)^2,2*sigma^2)))
> mtext(desc,side=1,line=4,padj=1,adj=0)
> mtext(expression(paste("where ",mu," is the mean of the distribution and ",sigma," the standard deviation.")),
+ side=1,line=7,padj=1,adj=0)
>
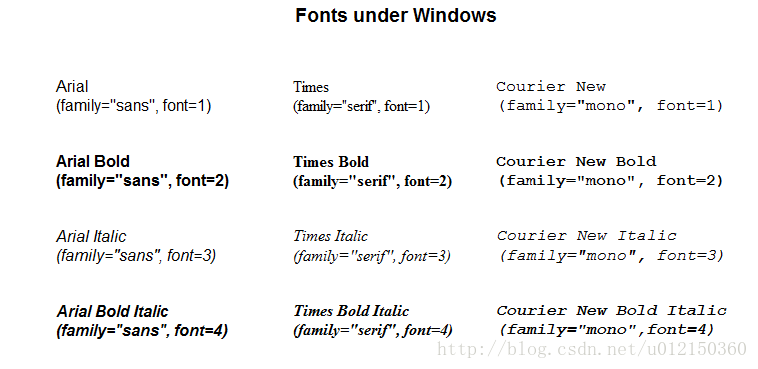
使用不同的字体
ar(mar=c(1,1,5,1))
plot(1:200,type="n",main="Fonts under Windows",axes=FALSE,xlab="",ylab="")
text(0,180,"Arial \n(family=\"sans\", font=1)",family="sans",font=1,adj=0)
text(0,140,"Arial Bold \n(family=\"sans\", font=2)",family="sans",font=2,adj=0)
text(0,100,"Arial Italic \n(family=\"sans\", font=3)",family="sans",font=3,adj=0)
text(0,60,"Arial Bold Italic \n(family=\"sans\", font=4)",family="sans",font=4,adj=0)
text(70,180,"Times \n(family=\"serif\", font=1)",family="serif",font=1,adj=0)
text(70,140,"Times Bold \n(family=\"serif\", font=2)",family="serif",font=2,adj=0)
text(70,100,"Times Italic \n(family=\"serif\", font=3)",family="serif",font=3,adj=0)
text(70,60,"Times Bold Italic \n(family=\"serif\", font=4)",family="serif",font=4,adj=0)
text(130,180,"Courier New\n(family=\"mono\", font=1)",family="mono",font=1,adj=0)
text(130,140,"Courier New Bold \n(family=\"mono\", font=2)",family="mono",font=2,adj=0)
text(130,100,"Courier New Italic \n(family=\"mono\", font=3)",family="mono",font=3,adj=0)
text(130,60,"Courier New Bold Italic \n(family=\"mono\",font=4)",family="mono",font=4,adj=0)
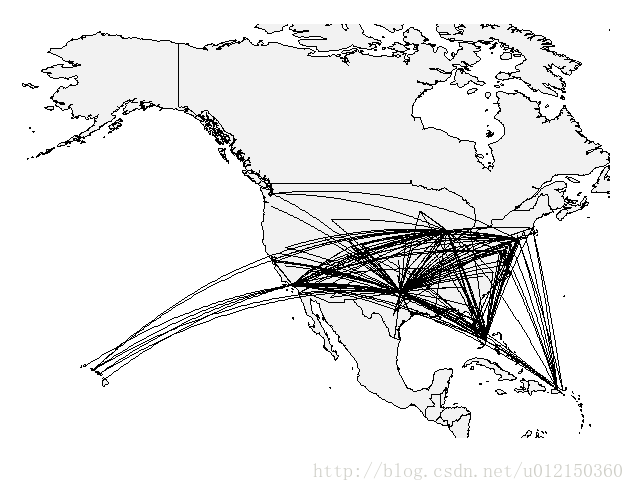
画联系图的例子
> library(geosphere)
> library(maps)
> xlim <- c(-171.738281, -56.601563)  #限定所画地图的经纬度
> ylim <- c(12.039321, 71.856229)
> map("world", col="#f2f2f2", fill=TRUE, bg="white", lwd=0.05, xlim=xlim, ylim=ylim)
> airports <- read.csv("http://datasets.flowingdata.com/tuts/maparcs/airports.csv", header=TRUE)
> flights <- read.csv("http://datasets.flowingdata.com/tuts/maparcs/flights.csv", header=TRUE, as.is=TRUE)
> fsub <- flights[flights$airline == "AA",]
> for (j in 1:length(fsub$airline)) {
+     air1 <- airports[airports$iata == fsub[j,]$airport1,]
+     air2 <- airports[airports$iata == fsub[j,]$airport2,]
+     inter <- gcIntermediate(c(air1[1,]$long, air1[1,]$lat), c(air2[1,]$long, air2[1,]$lat), n=100, addStartEnd=TRUE)
+     lines(inter, col="black", lwd=0.8)
+ }
改进代码
pal <- colorRampPalette(c("#f2f2f2", "black"))
colors <- pal(100)
map("world", col="#f2f2f2", fill=TRUE, bg="white", lwd=0.05, xlim=xlim, ylim=ylim)
fsub <- flights[flights$airline == "AA",]
maxcnt <- max(fsub$cnt)
for (j in 1:length(fsub$airline)) {
air1 <- airports[airports$iata == fsub[j,]$airport1,]
air2 <- airports[airports$iata == fsub[j,]$airport2,]
inter <- gcIntermediate(c(air1[1,]$long, air1[1,]$lat), c(air2[1,]$long, air2[1,]$lat), n=100, addStartEnd=TRUE)
colindex <- round( (fsub[j,]$cnt / maxcnt) * length(colors) )
lines(inter, col=colors[colindex], lwd=0.8)
}
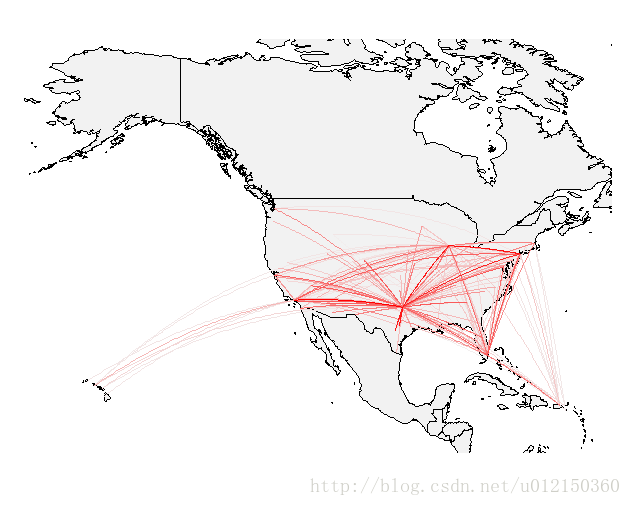
再次改进
pal <- colorRampPalette(c("#f2f2f2", "black"))
pal <- colorRampPalette(c("#f2f2f2", "red"))
colors <- pal(100)
map("world", col="#f2f2f2", fill=TRUE, bg="white", lwd=0.05, xlim=xlim, ylim=ylim)
fsub <- flights[flights$airline == "AA",]
fsub <- fsub[order(fsub$cnt),]
maxcnt <- max(fsub$cnt)
for (j in 1:length(fsub$airline)) {
air1 <- airports[airports$iata == fsub[j,]$airport1,]
air2 <- airports[airports$iata == fsub[j,]$airport2,]
inter <- gcIntermediate(c(air1[1,]$long, air1[1,]$lat), c(air2[1,]$long, air2[1,]$lat), n=100, addStartEnd=TRUE)
colindex <- round( (fsub[j,]$cnt / maxcnt) * length(colors) )
lines(inter, col=colors[colindex], lwd=0.8)
}
最终改进
pal <- colorRampPalette(c("#f2f2f2", "red"))
# Unique carriers
carriers <- unique(flights$airline)
# Color
pal <- colorRampPalette(c("#333333", "white", "#1292db"))
colors <- pal(100)
for (i in 1:length(carriers)) {
pdf(paste("carrier", carriers[i], ".pdf", sep=""), width=11, height=7)
map("world", col="#191919", fill=TRUE, bg="#000000", lwd=0.05, xlim=xlim, ylim=ylim)
fsub <- flights[flights$airline == carriers[i],]
fsub <- fsub[order(fsub$cnt),]
maxcnt <- max(fsub$cnt)
for (j in 1:length(fsub$airline)) {
air1 <- airports[airports$iata == fsub[j,]$airport1,]
air2 <- airports[airports$iata == fsub[j,]$airport2,]
inter <- gcIntermediate(c(air1[1,]$long, air1[1,]$lat), c(air2[1,]$long, air2[1,]$lat), n=100,
addStartEnd=TRUE)
colindex <- round( (fsub[j,]$cnt / maxcnt) * length(colors) )
lines(inter, col=colors[colindex], lwd=0.6)
}
dev.off()
}


