Radviz可视化原理
Radviz可视化原理是将一系列多维空间的点通过非线性方法映射到二维空间的可视化技术,是基于圆形平行坐标系的设计思想而提出的多维可视化方法。圆形的m条半径表示m维空间,使用坐标系中的一点代表多为信息对象,其实现原理参照物理学中物体受力平衡定理。
m 维空间的点{ Ai1,Ai2,...,Aim }映射到二维可视空间的位置由弹簧引力分析模型确定。
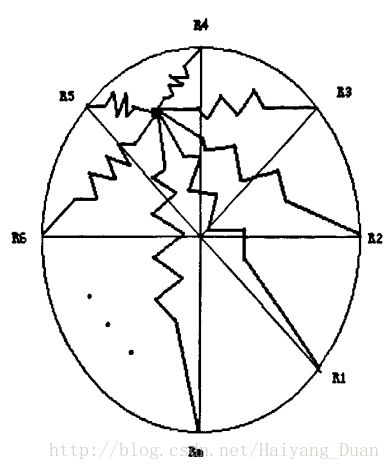
首先将一个圆等分成 m 份,等分点的个数由数据维度决定,记各等分点为{ R1,R2,...,Rn },每个等分点上固定一个弹簧,各个弹簧的弹性系数不同,弹簧 j 的弹性系数是 Aij ,也就是第 j 维的值,所有 m 个弹簧的另一端军固定在一个小圆上,如果这个小圆最终达到一个平衡位置 Bi={Xi,Yi}T ,则弹力平衡点 {Xi,Yi} 就是m维空间点{ Ai1,Ai2,...,Aim }在二维空间的投影点。
如下图所示:

每个弹簧作用在小圆上的力取决于该弹簧的弹簧拉伸和弹性系数,当小圆静止不动,则表明其受到所有弹簧的合力为0,由此可得到如下方程:
∑j=1,2,...,m(Rj−Bi)Aij=0−−−−−(1)
由此得到 Bi 的表达式:
Bi=∑j=1,2,...,mAijRj∑j=1,2,...,mAij−−−−−(2)
def radviz(frame, class_column, ax=None, color=None, colormap=None, **kwds):
    """RadViz - a multivariate data visualization algorithm

    Parameters:
    -----------
    frame: DataFrame
    class_column: str
        Column name containing class names
    ax: Matplotlib axis object, optional
    color: list or tuple, optional
        Colors to use for the different classes
    colormap : str or matplotlib colormap object, default None
        Colormap to select colors from. If string, load colormap with that name
        from matplotlib.
    kwds: keywords
        Options to pass to matplotlib scatter plotting method

    Returns:
    --------
    ax: Matplotlib axis object
    """
    import matplotlib.patches as patches

    '''
        数据归一化
    '''
    def normalize(series):
        a = min(series)
        b = max(series)
        return (series - a) / (b - a)

    n = len(frame)

    '''
        type(classes)=pandas.core.series.Series
        classes表示共有几个类别
        class_col表示每一个样本对应的类别
    '''
    classes = frame[class_column].drop_duplicates()
    class_col = frame[class_column]

    '''
        (1)pandas.DataFrame.drop
        表明删除数据,axis=0表示删除行,axis=1表示删除列,这里表明去掉最后一列表示类别的列
        (2)pandas.DataFrame.apply
        调用函数,但输入必须是DataFrame
        (3)df为150x7的二维矩阵,即原数据
    '''
    df = frame.drop(class_column, axis=1).apply(normalize)

    '''
        设定横轴、纵轴的取值范围
    '''
    if ax is None:
        ax = plt.gca(xlim=[-1, 1], ylim=[-1, 1])

    '''
        定义一个字典
    '''
    to_plot = {}
    colors = _get_standard_colors(num_colors=len(classes), colormap=colormap,
                                  color_type='random', color=color)
    for kls in classes:
        to_plot[kls] = [[], []]
    '''
       to_plot= {'Breakout': [[], []], 'FalseAlarm': [[], []]}
    '''
    m = len(frame.columns) - 1
    '''
        当 i=0,1,2,3,4,5,6 时,
           t=2π*0/7、2π*1/7、2π*2/7、2π*3/7、2π*4/7、2π*5/7、2π*6/7
        上述t值对应的余弦、正弦即s为
        [[ 1.          0.        ]
         [ 0.6234898   0.78183148]
         [-0.22252093  0.97492791]
         [-0.90096887  0.43388374]
         [-0.90096887 -0.43388374]
         [-0.22252093 -0.97492791]
         [ 0.6234898  -0.78183148]]
    '''
    s = np.array([(np.cos(t), np.sin(t))
                  for t in [2.0 * np.pi * (i / float(m))
                            for i in range(m)]])
    for i in range(n):
        row = df.iloc[i].values
        '''
            (1)np.expand_dims(row, axis=1)
                扩展维数,当axis=0时,扩展列,即在行上增加数据;[1,2]变为[[1,2]]
                         当axis=1时,扩展行,即在列上增加数据;[1,2]变为[[1],[2]]
            (2)np.repeat(row, 2, axis=1)
                幅值数组元素,2表示每个元素的复制次数
                当axis=0时,列不变,在行上复制元素;[[1],[2]]变为[[1],[1],[2],[2]]
                当axis=1时,行不变,在列上复制元素;[[1],[2]]变为[[1 1],[2 2]]
        '''
        row_ = np.repeat(np.expand_dims(row, axis=1), 2, axis=1)
        '''
            s * row_相当于两个数组相对应的位置相乘
            (s * row_).sum(axis=0)相当于对相应行上的数值求和,即求每一列的和
            此处对应公式(2)的分子,得到的是一个1X2的列表或数组
            row.sum()相当于求数组所有元素的和
            此处对应公式(2)的分母
        '''
        y = (s * row_).sum(axis=0) / row.sum()
        if i==0:
            print(row.sum())

        '''
            iat用于访问元素,访问150次,即样本个数
            查看当前样本i所对应的kls是A还是B,A和B表示类别
            然后再把相应的y值加入到以A或B为键的值里面
        '''
        kls = class_col.iat[i]
        '''
            to_plot= {'Breakout': [[y[0]], [y[1]]], 'FalseAlarm': [[y[0]], [y[1]]]}
            将y的第一个值加入到字典中键为kls的第一个数组中,如上所示
        '''
        '''
            将y的第二个值加入到字典中键为kls的第二个数组中,如上所示
        '''
        to_plot[kls][0].append(y[0])
        to_plot[kls][1].append(y[1])
    '''
        enumerate(sequence, [start=0])返回枚举对象
        sequence :序列、start=0 :下表从0开始
    '''
    for i, kls in enumerate(classes):
        '''
            一共循环两次
            第一次循环画出A的值,即'A': [[y[0]], [y[1]]]
            第二次循环画出B的值,即'B': [[y[0]], [y[1]]]
            此时[y[0]]对应于to_plot[kls][0],[y[1]]对应于to_plot[kls][1]
        '''
        ax.scatter(to_plot[kls][0], to_plot[kls][1], color=colors[i],
                   label=pprint_thing(kls), **kwds)
    ax.legend()
    '''
        在坐标轴中画圆,圆心(0.0,0.0),半径1.0,圆域无色
    '''
    ax.add_patch(patches.Circle((0.0, 0.0), radius=1.0, facecolor='none'))
    '''
        将属性注释到二维坐标图中
    '''
    for xy, name in zip(s, df.columns):

        '''
            画属性位置,位置坐标是数组s的每一行的两个值
        '''
        ax.add_patch(patches.Circle(xy, radius=0.025, facecolor='gray'))

        '''
            注释属性名称
        '''
        if xy[0] < 0.0 and xy[1] < 0.0:
            ax.text(xy[0] - 0.025, xy[1] - 0.025, name,
                    ha='right', va='top', size='small')
        elif xy[0] < 0.0 and xy[1] >= 0.0:
            ax.text(xy[0] - 0.025, xy[1] + 0.025, name,
                    ha='right', va='bottom', size='small')
        elif xy[0] >= 0.0 and xy[1] < 0.0:
            ax.text(xy[0] + 0.025, xy[1] - 0.025, name,
                    ha='left', va='top', size='small')
        elif xy[0] >= 0.0 and xy[1] >= 0.0:
            ax.text(xy[0] + 0.025, xy[1] + 0.025, name,
                    ha='left', va='bottom', size='small')

    ax.axis('equal')
return ax(1)将原数数据的每一行归一化;
(2)求出s;
| i | t | cos(t) | sin(t) |
|---|---|---|---|
| 0 | 2 * π * i / 7 | 1 | 0 |
| 1 | 2 * π * i / 7 | 0.6234898 | 0.78183148 |
| 2 | 2 * π * i / 7 | -0.22252093 | 0.97492791 |
| 3 | 2 * π * i / 7 | -0.90096887 | 0.43388374 |
| 4 | 2 * π * i / 7 | -0.90096887 | -0.43388374 |
| 5 | 2 * π * i / 7 | -0.22252093 | -0.97492791 |
| 6 | 2 * π * i / 7 | 0.6234898 | -0.78183148 |
(3)每一行数据,进行以下操作
例如:
    row=[ 0.26666667  0.22556391  0.66666667  0.18721461  0.22289157    0.9009901  0.48387097]

    则有:
    s=
    [[ 1.          0.        ]
    [ 0.6234898   0.78183148]
    [-0.22252093  0.97492791]
    [-0.90096887  0.43388374]
    [-0.90096887 -0.43388374]
    [-0.22252093 -0.97492791]
    [ 0.6234898  -0.78183148]]

    row_=
    [[ 0.26666667  0.26666667]
    [ 0.22556391  0.22556391]
    [ 0.66666667  0.66666667]
    [ 0.18721461  0.18721461]
    [ 0.22289157  0.22289157]
    [ 0.9009901   0.9009901 ]
    [ 0.48387097  0.48387097]]

    y=(s*row_).sum(axis=0)/row.sum()
    也就是说,二维数组s和row_对应的元素相乘,得到一个新的二维数组
    s*row_=[[ 0.26666667  0.        ]
            [ 0.1406368   0.17635297]
            [-0.14834729  0.64995194]
            [-0.16867454  0.08122938]
            [-0.20081836 -0.09670903]
            [-0.20048916 -0.8784004 ]
            [ 0.30168861 -0.37830556]]
    sum(axis=0)就是新二维数组每一列的和,即
    (s*row_).sum(axis=0)=[-0.00933727 -0.4458807 ],公式(2)的分子
    row.sum()是row的每一个元素相加的和,即2.953864488,公式(2)的分母
    所以就得到了y的坐标值
y=[-0.00316103 -0.15094826](a)优点是
- 计算复杂度低表达数据关系非常简单、直观、易于理解;
- 可显示的的维度大;
- 相似多维对象的投影点十分接近,容易发现聚类信息
(b)缺点是
- 海量信息对象投影点的交叠问题严重,如(0,0,…,0)与(a,a,…,a)的投影点一样