二分类结果分析工具函数
下面代码是我总结的针对二分类问题的预测结果分析工具函数。
代码中有详细的文档说明。所以可以直接看代码。
# -*- coding:utf-8 -*-

from __future__ import print_function
from __future__ import division

import numpy as np
import pandas as pd
import matplotlib.pyplot as plt
from sklearn.metrics import roc_curve, auc
from sklearn.metrics import confusion_matrix
from sklearn.metrics import f1_score

"""Model assessment tools.
"""


def print_confusion_matrix(y_true, y_pred):
    """打印分类混淆矩阵。
    Args:
        y_true: 真实类别。
        y_pred: 预测类别。
    """
    labels = list(set(y_true))
    conf_mat = confusion_matrix(y_true, y_pred, labels=labels)
    print("confusion_matrix(left labels: y_true, up labels: y_pred):")
    out = "labels\t"
    for i in range(len(labels)):
        out += (str(labels[i]) + "\t")
    print(out)
    for i in range(len(conf_mat)):
        out = (str(labels[i]) + "\t")
        for j in range(len(conf_mat[i])):
            out += (str(conf_mat[i][j]) + '\t')
        print(out)
    return conf_mat
输出示例:
confusion_matrix(left labels: y_true, up labels: y_pred):
labels  0   1
0   0   14627
1   0   93
def get_auc(y_true, y_pred_pos_prob, plot_ROC=False):
    """计算 AUC 值。
    Args:
        y_true: 真实标签,如 [0, 1, 1, 1, 0]
        y_pred_pos_prob: 预测每个样本为 positive 的概率。
        plot_ROC: 是否绘制  ROC 曲线。
    Returns:
       roc_auc: AUC 值.
       fpr, tpr, thresholds: see roc_curve.
    """
    fpr, tpr, thresholds = roc_curve(y_true, y_pred_pos_prob)
    roc_auc = auc(fpr, tpr)  # auc 值
    if plot_ROC:
        plt.plot(fpr, tpr, '-*', lw=1, label='auc=%g' % roc_auc)
        plt.xlim([-0.05, 1.05])
        plt.ylim([-0.05, 1.05])
        plt.xlabel('False Positive Rate')
        plt.ylabel('True Positive Rate')
        plt.title('Receiver operating characteristic example')
        plt.legend(loc="lower right")
        plt.show()
    return roc_auc, fpr, tpr, thresholds
输出示例:
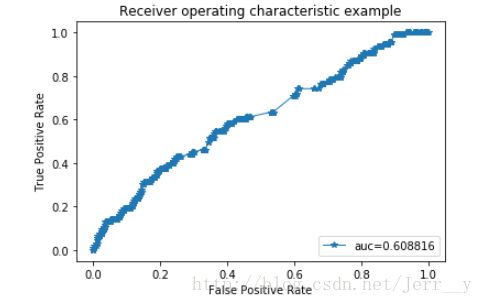
ROC 曲线
def evaluate(y_true, y_pred):
    """二分类预测结果评估。
    Args:
        y_true: list, 真实标签,如 [1, 0, 0, 1]
        y_pred: list,预测结果,如 [1, 1, 0, 1]
    Returns:
        返回正类别的评价指标。
        p: 预测为正类别的准确率: p = tp / (tp + fp)
        r: 预测为正类别的召回率: r = tp / (tp + fn)
        f1: 预测为正类别的 f1 值: f1 = 2 * p * r / (p + r).
    """
    conf_mat = confusion_matrix(y_true, y_pred)
    all_p = np.sum(conf_mat[:, 1])
    if all_p == 0:
        p = 1.0
    else:
        p = conf_mat[1, 1] / all_p
    r = conf_mat[1, 1] / np.sum(conf_mat[1, :])
    f1 = f1_score(y_true, y_pred)
    return p, r, f1


def feature_analyze(model, to_print=False, to_plot=True, csv_path=None):
    """XGBOOST 模型特征重要性分析。

    Args:
        model: 训练好的 xgb 模型。
        to_print: bool, 是否输出每个特征重要性。
        to_plot: bool, 是否绘制特征重要性图表。
        csv_path: str, 保存到 csv 文件路径。
    """
    feature_score = model.get_fscore()
    feature_score = sorted(feature_score.items(), key=lambda x: x[1], reverse=True)
    if to_plot:
        features = list()
        scores = list()
        for (key, value) in feature_score:
            features.append(key)
            scores.append(value)
        plt.barh(range(len(scores)), scores)
        plt.yticks(range(len(scores)), features)
        for i in range(len(scores)):
            plt.text(scores[i] + 0.75, i - 0.25, scores[i])
        plt.xlabel('feature socre')
        plt.title('feature score evaluate')
        plt.grid()
        plt.show()
    fs = []
    for (key, value) in feature_score:
        fs.append("{0},{1}\n".format(key, value))
    if to_print:
        print(''.join(fs))
    if csv_path is not None:
        with open(csv_path, 'w') as f:
            f.writelines("feature,score\n")
            f.writelines(fs)
    return feature_score
输出示例:
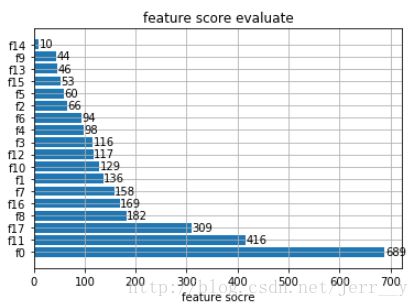
特征重要度