吴恩达机器学习第二次作业:逻辑回归
0.综述
训练集为学生两次考试的成绩和录取情况,要根据训练集做出一个逻辑回归的模型,可以根据考试成绩预测学生的录取情况。
1.Plotting
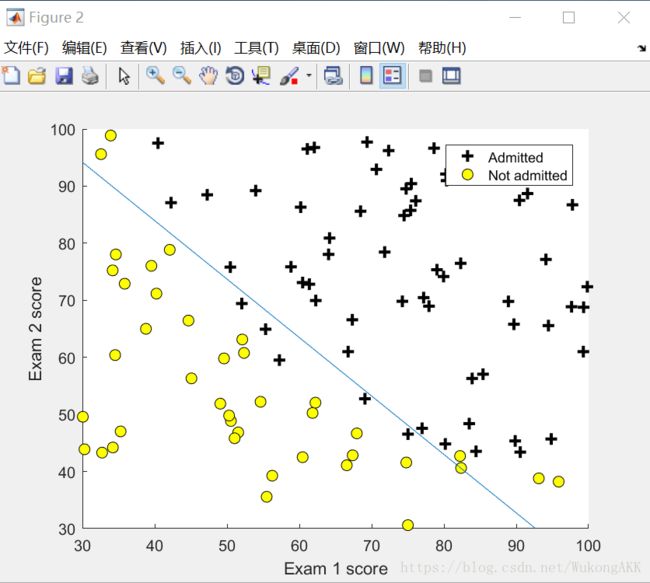
在二维坐标图内画出学生成绩的散点图,x和y对应两次考试的成绩。
function plotData(X, y)
%PLOTDATA Plots the data points X and y into a new figure
%   PLOTDATA(x,y) plots the data points with + for the positive examples
%   and o for the negative examples. X is assumed to be a Mx2 matrix.

% Create New Figure
figure; hold on;

% ====================== YOUR CODE HERE ======================
% Instructions: Plot the positive and negative examples on a
%               2D plot, using the option 'k+' for the positive
%               examples and 'ko' for the negative examples.
%
% 我自己写的
% n=size(y);
% for i=1:n
%     if (y(i) == 1)
%     plot(X(i,1),X(i,2),'k+')
%     else
%     plot(X(i,1),X(i,2),'ko')
%     end
% end

% Find Indices of Positive and Negative Examples
pos = find(y == 1); neg = find(y == 0);                                          %pos和neg均为矩阵
% Plot Examples
plot(X(pos, 1), X(pos, 2), 'k+','LineWidth', 2, 'MarkerSize', 7);
plot(X(neg, 1), X(neg, 2), 'ko', 'MarkerFaceColor', 'y','MarkerSize', 7);        %MarkerFaceColor是指定闭合闭合图形内部的颜色,MarkerSize是指定大小。


% =========================================================================


hold off;

end
2.Compute Cost and Gradient
计算代价函数
function [J, grad] = costFunction(theta, X, y)
%COSTFUNCTION Compute cost and gradient for logistic regression
%   J = COSTFUNCTION(theta, X, y) computes the cost of using theta as the
%   parameter for logistic regression and the gradient of the cost
%   w.r.t. to the parameters.

% Initialize some useful values
m = length(y); % number of training examples

% You need to return the following variables correctly
J = 0;
grad = zeros(size(theta));

% ====================== YOUR CODE HERE ======================
% Instructions: Compute the cost of a particular choice of theta.
%               You should set J to the cost.
%               Compute the partial derivatives and set grad to the partial
%               derivatives of the cost w.r.t. each parameter in theta
%
% Note: grad should have the same dimensions as theta
%

J= -1 * sum( y .* log( sigmoid(X*theta) ) + (1 - y ) .* log( (1 - sigmoid(X*theta)) ) ) / m ;

grad = ( X' * (sigmoid(X*theta) - y ) )/ m ;                %sigmoid函数就是那个阀值函数。


% =============================================================

end
这是sugmoid函数,它代表在一个输入下,输出为1的概率。
function g = sigmoid(z)
%SIGMOID Compute sigmoid functoon
%   J = SIGMOID(z) computes the sigmoid of z.

% You need to return the following variables correctly
g = zeros(size(z));

% ====================== YOUR CODE HERE ======================
% Instructions: Compute the sigmoid of each value of z (z can be a matrix,
%               vector or scalar).
g = 1 ./ ( 1 + exp(-z) ) ;
% =============================================================

end
3.Optimizing using fminunc
用fminunc来优化,fminunc利用自动选择的学习速率来进行梯度下降,使梯度下降可以更快更好的进行。
直接上脚本吧。。。
%  In this exercise, you will use a built-in function (fminunc) to find the
%  optimal parameters theta.

%  Set options for fminunc
options = optimset('GradObj', 'on', 'MaxIter', 400);

%  Run fminunc to obtain the optimal theta
%  This function will return theta and the cost
[theta, cost] = ...
	fminunc(@(t)(costFunction(t, X, y)), initial_theta, options);

% Print theta to screen
fprintf('Cost at theta found by fminunc: %f\n', cost);
fprintf('theta: \n');
fprintf(' %f \n', theta);

% Plot Boundary
plotDecisionBoundary(theta, X, y);

% Put some labels
hold on;
% Labels and Legend
xlabel('Exam 1 score')
ylabel('Exam 2 score')

% Specified in plot order
legend('Admitted', 'Not admitted')
hold off;

fprintf('\nProgram paused. Press enter to continue.\n');
pause;
简单说一下:
1. optimset('GradObj', 'on', 'MaxIter', 400); 这句话中,<'GradObj', 'on'>代表在fminunc函数中使用自定义的梯度下降函数 , < 'MaxIter', 400>代表最大迭代次数为400。
2. fminunc(@(t)(costFunction(t, X, y)), initial_theta, options); 这句话中,<@(t)(costFunction(t, X, y)>代表传入一个函数,@ 是一个句柄,类似于C中的指针。< initial_theta>是传入的theta矩阵。
4.Predict and Accuracies
做预测。
predict函数。
function p = predict(theta, X)
%PREDICT Predict whether the label is 0 or 1 using learned logistic
%regression parameters theta
%   p = PREDICT(theta, X) computes the predictions for X using a
%   threshold at 0.5 (i.e., if sigmoid(theta'*x) >= 0.5, predict 1)

m = size(X, 1); % Number of training examples

% You need to return the following variables correctly
p = zeros(m, 1);                                                        %初始化p向量为0

% ====================== YOUR CODE HERE ======================
% Instructions: Complete the following code to make predictions using
%               your learned logistic regression parameters.
%               You should set p to a vector of 0's and 1's
%

k = find(sigmoid( X * theta) >= 0.5 );
p(k)= 1;                                      % k是输入数据中预测结果为1的数据的下标,令p向量中的这些分量为1。

% p(sigmoid( X * theta) >= 0.5) = 1;   % it's a more compat way.


% =========================================================================


end
