TensorFlow学习--TensorBoard神经网络可视化
本机:[ubuntu16.04 + Pycharm + python2.7 + tensorflow1.3.0 ]
TensorBoard是TensorFlow的一套可视化工具,通过读取 TensorFlow 的事件文件来运行.
一般是先创建要汇总的图(graph),然后选择需要在那些节点(op)进行汇总(summary)操作.
例子(具体见代码注释):
# TensorBoard可视化

import tensorflow as tf
import numpy as np

# 添加一个图层并返回此图层的输出
def add_layer(inputs, in_size, out_size, n_layer, activation_function=None):
    layer_name = 'layer%s' % n_layer
    # name_scope:域重名即当命名域重名的时候自动对重名的域打上序号
    with tf.name_scope('layer'):
        with tf.name_scope('weights'):
            # 构建权重:in_size*out_size大小的矩阵
            Weights = tf.Variable(tf.random_normal([in_size, out_size]), name='W')
            # 生成直方图summary(name:生成节点的名称;values:一个真正的数字Tensor)
            tf.summary.histogram(layer_name + '/weights', Weights)
        with tf.name_scope('biases'):
            # 构建偏执:1*out_size的矩阵
            biases = tf.Variable(tf.zeros([1, out_size]) + 0.1, name='b')
            # 输出具有直方图的summary协议缓冲区,添加直方图摘要可以使数据可视化
            tf.summary.histogram(layer_name + '/biases', biases)
        with tf.name_scope('Wx_plus_b'):
            # # weights*x + biases
            Wx_plus_b = tf.add(tf.matmul(inputs, Weights), biases, name='Wxb')
        if activation_function is None:
            outputs = Wx_plus_b
        else:
            outputs = activation_function(Wx_plus_b)
        # 添加直方图摘要可以使数据可视化
        tf.summary.histogram(layer_name + '/outputs', outputs)
        return outputs


# 定义x,y的占位符作为将要输入神经网络的变量
with tf.name_scope('inputs'):
    xs = tf.placeholder(tf.float32, [None, 1], name='x_input')
    ys = tf.placeholder(tf.float32, [None, 1], name='y_input')

# 构建500个处于-1到1的点,并将1维数组转换为一个500*1的2维数组
x_data = np.linspace(-1.0, 1.0, 500, dtype=np.float32)[:, np.newaxis]
# 加入噪声使它与x_data的维度一致,且服从N(0,0.2)
noise = np.random.normal(0.0, 0.2, x_data.shape)
y_data = np.power(x_data, 3) + 2 + noise


# 添加隐藏层,激活函数用Relu()
l1 = add_layer(xs, 1, 10, n_layer=1, activation_function=tf.nn.relu)
# 添加输出层
prediction = add_layer(l1, 10, 1, n_layer=2, activation_function=None)
# 预测与实际数据之间的误差
with tf.name_scope('loss'):
    loss = tf.reduce_mean(tf.reduce_sum(tf.square(ys - prediction), 1), name='L')
    tf.summary.scalar('loss', loss)
with tf.name_scope('train'):
    # 以0.1的效率最小化损失
    train_step = tf.train.GradientDescentOptimizer(0.1).minimize(loss)


# 对所有变量进行初始化
init = tf.initialize_all_variables()
with tf.Session() as sess:
    sess.run(init)

    # 合并在默认图表中收集的所有摘要  如果没有收集摘要则返回无,否则返回标量
    # 将之前定义的所有summary op整合到一起
    merged = tf.summary.merge_all()
    # 创建一个FileWriter和一个事件文件,向硬盘tmp文件夹下写summary数据
    writer = tf.summary.FileWriter('/tmp/logs', sess.graph)
    for i in range(1500):
        sess.run(train_step, feed_dict={xs: x_data, ys: y_data})
        if i % 100 == 0:
            print(i, sess.run(loss, feed_dict={xs: x_data, ys: y_data}))
            result, prediction_value = sess.run([merged, prediction], feed_dict={xs: x_data, ys: y_data})
            writer.add_summary(result, i)
输出:
(0, 2.1827598)
(100, 0.049588822)
(200, 0.04671485)
(300, 0.043870702)
(400, 0.042638462)
(500, 0.041867945)
(600, 0.04136683)
(700, 0.040885087)
(800, 0.040453255)
(900, 0.04010734)
(1000, 0.039749168)
(1100, 0.039491516)
(1200, 0.039256092)
(1300, 0.039072316)
(1400, 0.038935676)
打开ubuntu终端,输入:
tensorboard --logdir='/tmp/logs'可得到如图所示:
在浏览器中打开所示的
http://*************:6006 即可启动TensorBoard:
可以在SCALARS中看到loss随着训练step的增加逐渐减小的趋势

可以在GRAPHS中看到神经网络的结构

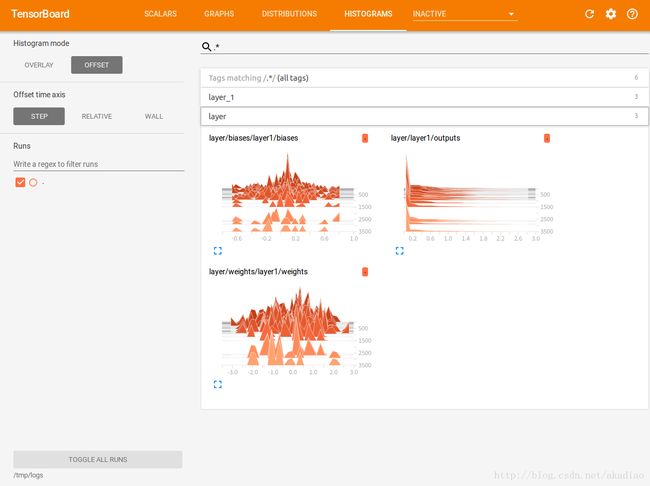
HISTOGRAMS


