模型评估和超参数调整(三)——学习曲线和验证曲线 learning curves and validation curves
读《python machine learning》chapt 6
Learning Best Practices for Model Evaluation and Hyperparameter Tuning
【主要内容】
(1)获得对模型评估的无偏估计
(2)诊断机器学习算法的常见问题
(3)调整机器学习模型
(4)使用不同的性能指标对评估预测模型
git源码地址 https://github.com/xuman-Amy/Model-evaluation-and-Hypamameter-tuning
【learning curves and validation curves】
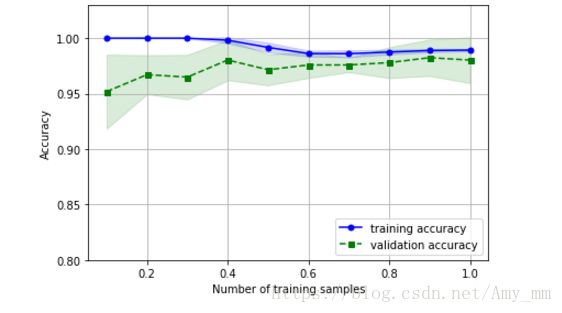
高方差和高偏差情况下的学习曲线
【解决方法】
高偏差(high bias):训练集和交叉验证的正确率都很低
(1)增加模型参数,比如收集更多或者创建更多特征
(2)降低正则化参数(decreasing the degree of regularization),比如在SVM 或者LR 分类器中。
高方差(high variance):训练集和交叉验证的正确率相差太大
(1)增加更多的训练数据
(2)降低模型的复杂度
(3)增加模型的正则化参数
【利用sklearn库的学习曲线评估模型】
import matplotlib.pyplot as plt
from sklearn.model_selection import learning_curve
pipe_lr = make_pipeline(StandardScaler(),
                        LogisticRegression(penalty = 'l2',
                                           random_state = 1))
train_size, train_scores, test_scores = learning_curve(estimator = pipe_lr,
                                                     X = X_train,
                                                     y = y_train,
                                                     train_sizes = np.linspace(0.1, 1.0, 10), #从0.1到1 一共10个间隔相同的数
                                                     cv = 10,
                                                     n_jobs = 1)

train_mean = np.mean(train_scores, axis=1)
train_std = np.std(train_scores, axis=1)
test_mean = np.mean(test_scores, axis=1)
test_std = np.std(test_scores, axis=1)

plt.plot(train_sizes, train_mean,
         color='blue', marker='o',
         markersize=5, label='training accuracy')

plt.fill_between(train_sizes,
                 train_mean + train_std,
                 train_mean - train_std,
                 alpha=0.15, color='blue')

plt.plot(train_sizes, test_mean,
         color='green', linestyle='--',
         marker='s', markersize=5,
         label='validation accuracy')


plt.fill_between(train_sizes,
                 test_mean + test_std,
                 test_mean - test_std,
                 alpha=0.15, color='green')


plt.grid()
plt.xlabel('Number of training samples')
plt.ylabel('Accuracy')
plt.legend(loc='lower right')
plt.ylim([0.8, 1.03])
plt.tight_layout()
plt.show()
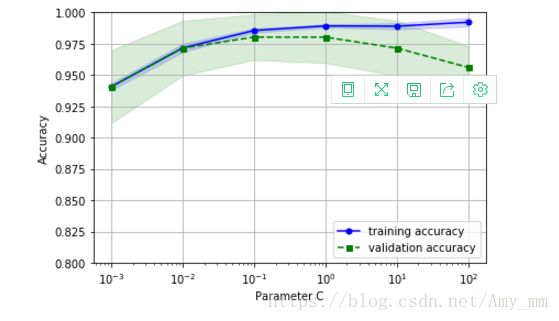
【利用sklearn库的 验证曲线 评估模型】
from sklearn.model_selection import validation_curve
param_range = [0.001,0.01, 0.1, 1.0, 10.0, 100.0]
train_scores, test_scores = validation_curve(estimator = pipe_lr,
                                             X = X_train,
                                             y = y_train,
                                             param_name = 'logisticregression__C',
                                             param_range = param_range,
                                             cv = 10)
train_mean = np.mean(train_scores, axis=1)
train_std = np.std(train_scores, axis=1)
test_mean = np.mean(test_scores, axis=1)
test_std = np.std(test_scores, axis=1)

plt.plot(param_range, train_mean,
         color='blue', marker='o',
         markersize=5, label='training accuracy')

plt.fill_between(param_range, train_mean + train_std,
                 train_mean - train_std, alpha=0.15,
                 color='blue')

plt.plot(param_range, test_mean,
         color='green', linestyle='--',
         marker='s', markersize=5,
         label='validation accuracy')

plt.fill_between(param_range,
                 test_mean + test_std,
                 test_mean - test_std,
                 alpha=0.15, color='green')

plt.grid()
plt.xscale('log')
plt.legend(loc='lower right')
plt.xlabel('Parameter C')
plt.ylabel('Accuracy')
plt.ylim([0.8, 1.0])
plt.tight_layout()
plt.show()
从图中看出,最优C为0.1-0.01之间,继续增大C(减小正则化强度)出现过拟合现象;但如果继续减小C(增强正则化强度),出现拟合不够的现象。 另外~C为正则化参数的倒数。


