ggplot2画柱状图
柱状图一般有三种形式:
- 填充式
- 堆积式
- 并列式
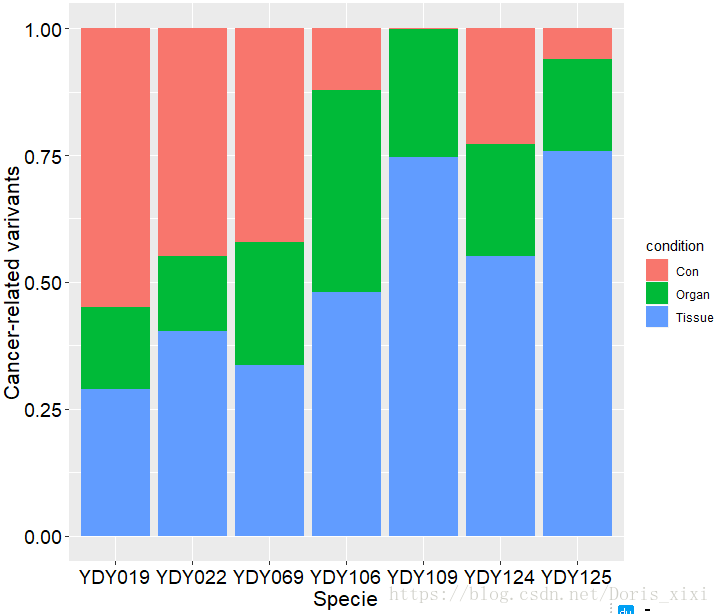
填充式
1)填充式需要设定几何对象geom_bar()的参数position='fill'(堆叠数据,百分比展示)
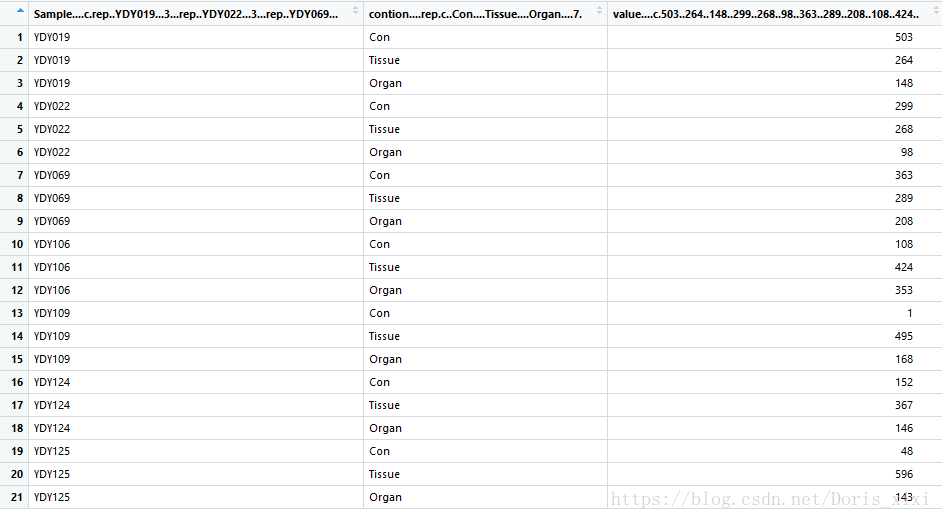
首先数据格式是这样的:
library(ggplot2)

data<-data.frame(Sample<-c(rep('YDY019',3),rep('YDY022',3),rep('YDY069',3),rep('YDY106',3),rep('YDY109',3),rep('YDY124',3),rep('YDY125',3)),
                   contion<-rep(c('Con','Tissue','Organ'),7),
                   value<-c(503,264,148,299,268,98,363,289,208,108,424,353,1,495,168,152,367,146,48,596,143))
#给每列命名
colnames(data)[1:3]<-c("Sample","condition","Cancer-related varivants")

#画图
ggplot(data, aes(Sample,value, fill=condition))+geom_bar(stat='identity',position='fill') +labs(x = 'Specie',y = 'Cancer-related varivants') +theme(axis.title =element_text(size = 16),axis.text =element_text(size = 14, color = 'black'))
结果图:
ggplot:
Usage
ggplot(data = NULL, mapping = aes(), ..., environment = parent.frame())
Arguments
data |
Default dataset to use for plot. If not already a data.frame, will be converted to one by |
mapping |
Default list of aesthetic mappings to use for plot. If not specified, must be supplied in each layer added to the plot. |
... |
Other arguments passed on to methods. Not currently used. |
environment |
DEPRECATED. Used prior to tidy evaluation. |
geom_bar
Usage
geom_bar(mapping = NULL, data = NULL, stat = "count",
  position = "stack", ..., width = NULL, binwidth = NULL, na.rm = FALSE,
  show.legend = NA, inherit.aes = TRUE)

geom_col(mapping = NULL, data = NULL, position = "stack", ...,
  width = NULL, na.rm = FALSE, show.legend = NA, inherit.aes = TRUE)

stat_count(mapping = NULL, data = NULL, geom = "bar",
  position = "stack", ..., width = NULL, na.rm = FALSE,
  show.legend = NA, inherit.aes = TRUE)
Arguments
mapping |
Set of aesthetic mappings created by |
data |
The data to be displayed in this layer. There are three options: If A A |
position |
Position adjustment, either as a string, or the result of a call to a position adjustment function. |
... |
Other arguments passed on to |
width |
Bar width. By default, set to 90% of the resolution of the data. |
binwidth |
|
na.rm |
If |
show.legend |
logical. Should this layer be included in the legends? |
inherit.aes |
If |
geom, stat |
Override the default connection between |
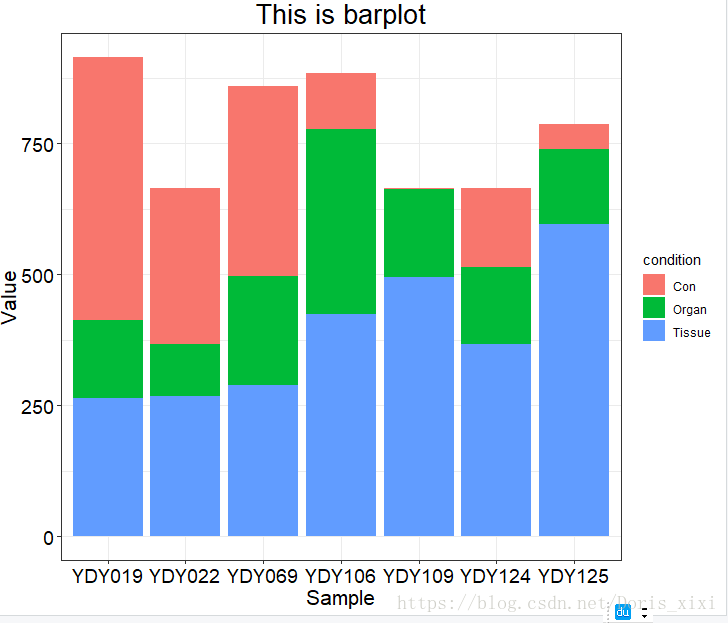
2)堆积式需要设定几何对象geom_bar()的参数position = 'stack'(堆叠数据,非百分比展示)
#theme_bw()加框
ggplot(data,aes(Sample,value,fill=condition))+geom_bar(stat='identity', position='stack')+theme_bw() +labs(x = 'Sample',y = 'Value', title = 'This is barplot')+theme(axis.title =element_text(size = 16),axis.text =element_text(size = 14, color = 'black'),plot.title =element_text(hjust = 0.5, size = 20))
结果展示:
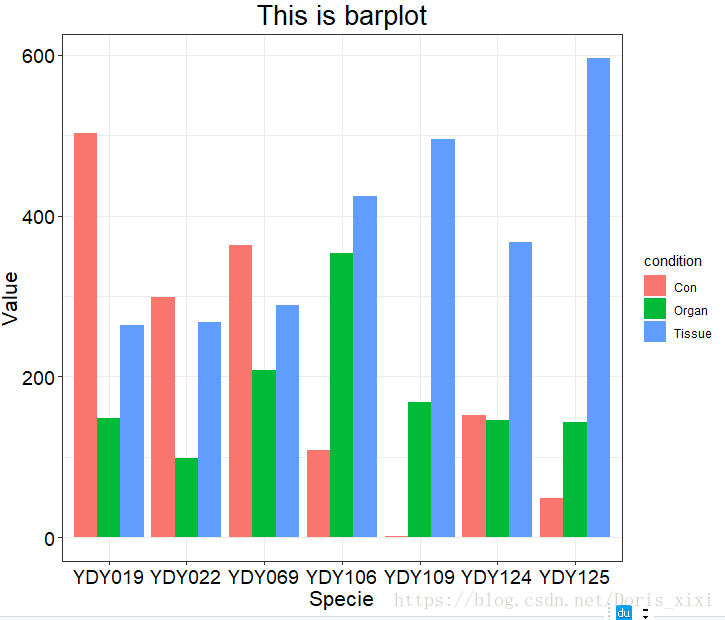
3)并列式需要设定几何对象geom_bar()的参数position= 'dodge'(并列数据,非百分比展示)
ggplot(data,aes(x=Sample,y=value,fill=condition))+geom_bar(stat='identity', position='dodge') +theme_bw() +labs(x = 'Specie',y = 'Value', title = 'This is barplot') +theme(axis.title =element_text(size = 16),axis.text =element_text(size = 14, color = 'black'),plot.title =element_text(hjust = 0.5, size = 20))