Python 数据分析 pandas
Pandas是一个开源的Python数据分析库。
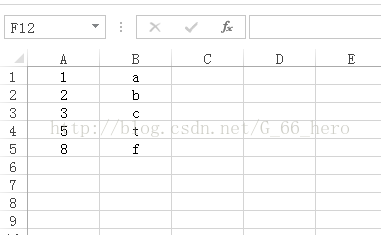
既然是读入Excel,那个读取到的结果也必然是Excel的形式:
Excel的形式为:
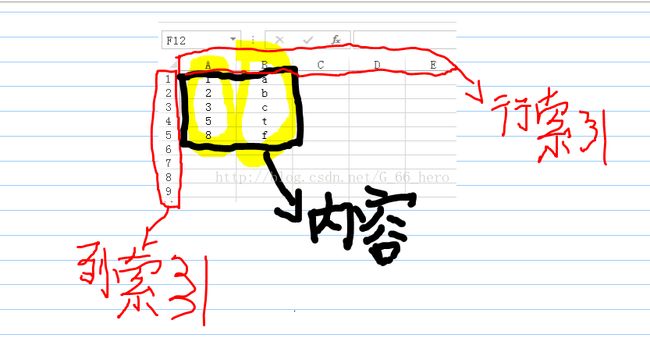
对Excel形式的说明:
Pandas把结构化数据分为了三类:
1、Series : 一维序列,可视作为没有column名的、只有一个column的DataFrame;
eg:
import pandas as pd
import numpy as ny

path = '/home/gll/Desktop/chapter3/demo/data/catering_sale.xls'
readFile=pd.read_excel(path)

b=pd.Series([1,2,3,5,8])
print b
注意:pandas会默认创建整型索引(从0开始)输出结果:
0 1
1 2
2 3
3 5
4 8
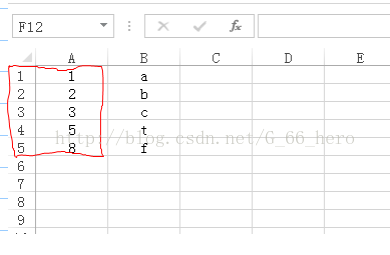
dtype: int64对应的Excel为:
2、DataFrame : 为多column并schema化的二维结构化数据,可视作为Series的容器 ( container ) ;
eg:import pandas as pdimport numpy as nypath = '/home/gll/Desktop/chapter3/demo/data/catering_sale.xls'readFile=pd.read_excel(path)b=pd.Series([1,2,3,5,8])c=pd.Series(['a','b','c','t','f'])d=pd.DataFrame([b,c])print d
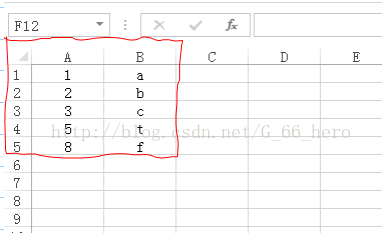
输出的结果为:0 1 2 3 40 1 2 3 5 81 a b c t f
对应的Excel为:
自己理解:一维数组的形式为:[1,2,3,5,8] ;,然而,Series的形式是把一维数组竖着写(即以列的形式存在),并且添加了索引(因为只有一列,所以没有列索引,只添加行索引,这个索引可以是自己设置的,自己不设置时为默认);DataFrame的形式是多个Series,但是和Series不同的是,DataFrame可能存储多个Series(因为Series以列的形式存在,所以DataFrame就是多列),所以可能有多列,因此,它不仅有行索引,同时还有列索引(同理:如果不设置索引,就是默认的索引)
注意:
pandas.read_excel();返回的就是DataFrame
eg:
输出结果为:import pandas as pd import numpy as ny path = '/home/gll/Desktop/chapter3/demo/data/catering_dish_profit.xls' readFile=pd.read_excel(path) print readFile
  菜品ID  菜品名    盈利
0  17148   A1  9173
1  17154   A2  5729
2    109   A3  4811
3    117   A4  3594
4  17151   A5  3195
5     14   A6  3026
6   2868   A7  2378
7    397   A8  1970
8     88   A9  1877
9    426  A10  1782
3、 Panel : 为三维的结构化数据,可是作为DataFrame的容器 ;
DataFrame中的方法:
.index 为行索引(即行标号)
.columns 为列名称(label即列标)
.dtypes 为列数据类型(数据集中每一列的数据类型)
.values 为获取DataFrame中的值(list的形式返回)
import pandas as pd
import numpy as ny

path = '/home/gll/Desktop/chapter3/demo/data/catering_dish_profit.xls'
readFile=pd.read_excel(path)
f=pd.DataFrame({'a':[1,1,1],'b':[1,2,2],'c':[1,2,3]})
print '='*10,'f','='*10
print f
print '='*10,'f.dtypes','='*10
print f.dtypes
print '='*10,'f.values','='*10
print f.values
print '='*10,'f.columns','='*10
print f.columns
print '='*10,'f.index','='*10
print f.index========== f ==========
a b c
0 1 1 1
1 1 2 2
2 1 2 3
========== f.dtypes ==========
a int64
b int64
c int64
dtype: object
========== f.values ==========
[[1 1 1]
[1 2 2]
[1 2 3]]
========== f.columns ==========
Index([u'a', u'b', u'c'], dtype='object')
========== f.index ==========
RangeIndex(start=0, stop=3, step=1)Pandas不但可以根据列名称选择,还可以根据列所在的position选择。相关函数为:
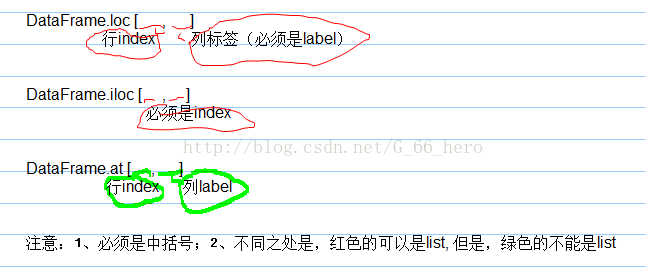
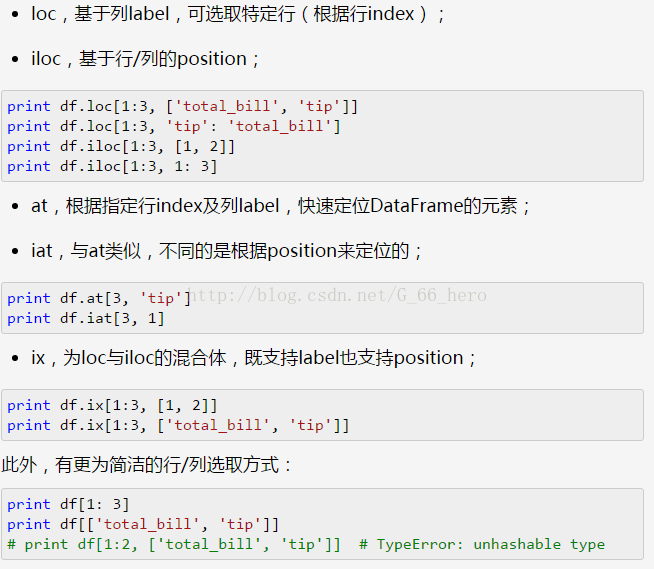
.loc 基于列label,可选取特定行(根据行index)
.iloc 基于行/列的position
.at 根据指定行index及列label ,快速定位DataFrame 的元素
.iat 与at类似,不同的是根据position来定位的
.ix 为loc与iloc的混合体,既支持label 也支持 position
eg:
代码:
import pandas as pd
import numpy as ny

path = '/home/gll/Desktop/chapter3/demo/data/catering_dish_profit.xls'
readFile=pd.read_excel(path)
f=pd.DataFrame({'a':[1,1,1],'b':[1,2,2],'c':[1,2,3]})
print '='*10,'f','='*10
print f
print '='*10,'f.loc[1,\'c\']','='*10
print f.loc[1,'c']
print '='*10,'f.iloc[0:2,1]','='*10
print f.iloc[0:2,1]
print '='*10,'f.at[1,\'c\']','='*10
print f.at[1,'c']========== f ==========
a b c
0 1 1 1
1 1 2 2
2 1 2 3
========== f.loc[1,'c'] ==========
2
========== f.iloc[0:2,1] ==========
0 1
1 2
Name: b, dtype: int64
========== f.at[1,'c'] ==========
2