计算机视觉(十):梯度下降优化算法
1 - 引言
我们知道,神经网络使用的是梯度下降来最小化损失函数,来获得最优解,因此如何使用更好的梯度下降算法,关系到我们神经网络的训练速度和准确率,因此,如何利用算得的损失函数及其关于模型参数的梯度,就成为了对神经网络最优化的核心问题。
我们在optim.py文件中构建这些梯度下降算法
之前,我们使用的是随机梯度下降(stochastic gradient descent)
def sgd(w, dw, config=None):
    """
    Performs vanilla stochastic gradient descent.
    config format:
    - learning_rate: Scalar learning rate.
    """
    if config is None: config = {}
    config.setdefault('learning_rate', 1e-2)

    w -= config['learning_rate'] * dw
    return w, config
这个方法是最简单也是最好理解的了,就是权重减去当前的梯度方向数值,但是实践证明这种算法可能在实际训练过程中效果不是很理想,所以,我们需要优化这个梯度下降的过程
2 - 动量随机梯度下降(momentum)
这种方法是从屋里角度上对最优化问题得到的启发,将梯度下降方法看做是将初速度为0的小球从在一个山体表面上放手,不同损失值代表山体表面的海拔高度,那么模型参数的更新不再去参考小球所在处的山体倾斜情况,而是改用小球的速度矢量在模型参数空间的投影来修正更新参数。

参数更新后,每一点的梯度矢量和速度矢量一般是不同的,小球所受到的合外力可以看做是保守力,就是损失函数的负梯度( F = − ▽ L F = -\triangledown L F=−▽L),再用牛顿定理( F = m a = m d v d t F = ma = m\frac{dv}{dt} F=ma=mdtdv),就可以得到动量关于时间的变化关系——亦所谓动量定理( F d t = m d v Fdt=mdv Fdt=mdv),若在单位时间t上两边积分,且单位时间t内看做每一次模型参数的迭代更新的化,就可以给出动量更新的表达式: p 1 = p 0 − α ▽ L p_1=p_0-\alpha \triangledown L p1=p0−α▽L(其中,学习率a,动量p = mv并默认了单数时间t内负梯度时域时间不相关的函数)。与BN算法中的一次指数平滑法类似,我们可以在迭代更新动量的过程中引入第二个超参数 μ \mu μ,以指数衰减的方式“跟踪”上一次“动量”的更新: p 1 = μ p 0 − α ▽ L p_1=\mu p_0 - \alpha \triangledown L p1=μp0−α▽L,最后将这个动量矢量投影到参数空间去更新新模型参数
def sgd_momentum(w, dw, config=None):
    """
    Performs stochastic gradient descent with momentum.
    config format:
    - learning_rate: Scalar learning rate.
    - momentum: Scalar between 0 and 1 giving the momentum value.
      Setting momentum = 0 reduces to sgd.
    - velocity: A numpy array of the same shape as w and dw used to store a moving
      average of the gradients.
    """
    if config is None: config = {}
    config.setdefault('learning_rate', 1e-2)
    config.setdefault('momentum', 0.9)
    v = config.get('velocity', np.zeros_like(w))

    next_w = None

    v = config['momentum'] * v - config['learning_rate'] * dw
    next_w = w + v

    config['velocity'] = v

    return next_w, config
现在,我们可以测试一下,这两种梯度下降给模型训练带来的区别
import time
import numpy as np
import matplotlib.pyplot as plt
from cs231n.classifiers.fc_net import *
from cs231n.data_utils import get_CIFAR10_data
from cs231n.gradient_check import eval_numerical_gradient, eval_numerical_gradient_array
from cs231n.solver import Solver

def rel_error(x, y):
  """ returns relative error """
  return np.max(np.abs(x - y) / (np.maximum(1e-8, np.abs(x) + np.abs(y))))


data = get_CIFAR10_data()

num_train = 4000
small_data = {
  'X_train': data['X_train'][:num_train],
  'y_train': data['y_train'][:num_train],
  'X_val': data['X_val'],
  'y_val': data['y_val'],
}

solvers = {}

for update_rule in ['sgd', 'sgd_momentum']:
  print('running with ', update_rule)
  model = FullyConnectedNet([100, 100, 100, 100, 100], weight_scale=5e-2)

  solver = Solver(model, small_data,
                  num_epochs=5, batch_size=100,
                  update_rule=update_rule,
                  optim_config={
                    'learning_rate': 1e-2,
                  },
                  verbose=True)
  solvers[update_rule] = solver
  solver.train()
  print()

plt.subplot(3, 1, 1)
plt.title('Training loss')


plt.subplot(3, 1, 2)
plt.title('Training accuracy')


plt.subplot(3, 1, 3)
plt.title('Validation accuracy')


for update_rule, solver in solvers.items():
  plt.subplot(3, 1, 1)
  plt.plot(solver.loss_history, 'o', label=update_rule)

  plt.subplot(3, 1, 2)
  plt.plot(solver.train_acc_history, '-o', label=update_rule)

  plt.subplot(3, 1, 3)
  plt.plot(solver.val_acc_history, '-o', label=update_rule)

for i in [1, 2, 3]:
  plt.subplot(3, 1, i)
  plt.legend(loc='upper center', ncol=4)
plt.gcf().set_size_inches(15, 15)
plt.show()
结果如下:

可以看到不管是收敛速度,还是准确率,使用动量方法的随机梯度下降在性能上都有一定的提升
3 - rmsprop算法
RMSProp算法的全称叫 Root Mean Square Prop,是Geoffrey E. Hinton在Coursera课程中提出的一种优化算法,其思想是进一步优化损失函数在更新中存在摆动幅度过大的问题,进一步加快函数收敛速度
def rmsprop(x, dx, config=None):
    """
    Uses the RMSProp update rule, which uses a moving average of squared gradient
    values to set adaptive per-parameter learning rates.
    config format:
    - learning_rate: Scalar learning rate.
    - decay_rate: Scalar between 0 and 1 giving the decay rate for the squared
      gradient cache.
    - epsilon: Small scalar used for smoothing to avoid dividing by zero.
    - cache: Moving average of second moments of gradients.
    """
    if config is None: config = {}
    config.setdefault('learning_rate', 1e-2)
    config.setdefault('decay_rate', 0.99)
    config.setdefault('epsilon', 1e-8)
    config.setdefault('cache', np.zeros_like(x))

    next_x = None

    config['cache'] = config['decay_rate'] * config['cache'] + (1 - config['decay_rate']) * (dx ** 2)
    next_x = x - config['learning_rate'] * dx / (np.sqrt(config['cache']) + config['epsilon'])


    return next_x, config
4 - Adam 算法
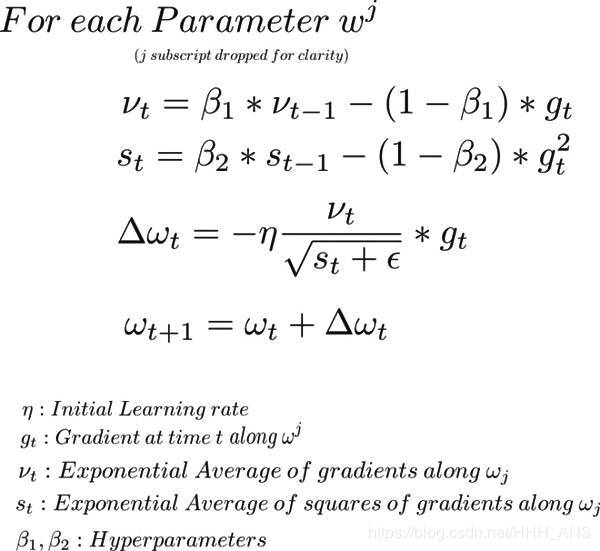
Adam 或 Adaptive Moment Optimization 算法将 Momentum 和 RMSProp 两种算法结合了起来。 这种算法是效果比较好的一种优化算法,也是深度学习中经常使用的一种算法,这里是迭代方程。

def adam(x, dx, config=None):
    """
    Uses the Adam update rule, which incorporates moving averages of both the
    gradient and its square and a bias correction term.
    config format:
    - learning_rate: Scalar learning rate.
    - beta1: Decay rate for moving average of first moment of gradient.
    - beta2: Decay rate for moving average of second moment of gradient.
    - epsilon: Small scalar used for smoothing to avoid dividing by zero.
    - m: Moving average of gradient.
    - v: Moving average of squared gradient.
    - t: Iteration number.
    """
    if config is None: config = {}
    config.setdefault('learning_rate', 1e-3)
    config.setdefault('beta1', 0.9)
    config.setdefault('beta2', 0.999)
    config.setdefault('epsilon', 1e-8)
    config.setdefault('m', np.zeros_like(x))
    config.setdefault('v', np.zeros_like(x))
    config.setdefault('t', 0)

    next_x = None

    config['t'] += 1
    config['m'] = config['beta1'] * config['m'] + (1 - config['beta1']) * dx
    config['v'] = config['beta2'] * config['v'] + (1 - config['beta2']) * (dx ** 2)
    mb = config['m'] / (1 - config['beta1'] ** config['t'])
    vb = config['v'] / (1 - config['beta2'] ** config['t'])
    next_x = x - config['learning_rate'] * mb / (np.sqrt(vb) + config['epsilon'])


    return next_x, config
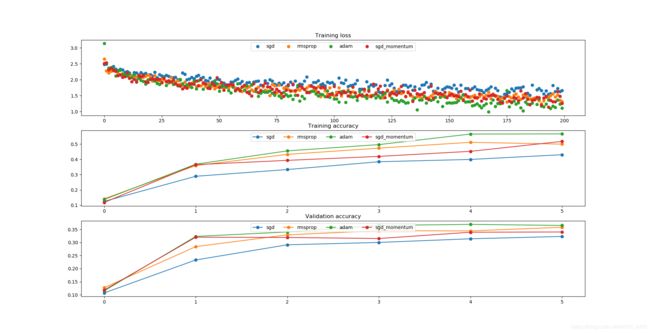
下面我们来测试一下:
import time
import numpy as np
import matplotlib.pyplot as plt
from cs231n.classifiers.fc_net import *
from cs231n.data_utils import get_CIFAR10_data
from cs231n.gradient_check import eval_numerical_gradient, eval_numerical_gradient_array
from cs231n.solver import Solver

def rel_error(x, y):
  """ returns relative error """
  return np.max(np.abs(x - y) / (np.maximum(1e-8, np.abs(x) + np.abs(y))))


data = get_CIFAR10_data()

num_train = 4000
small_data = {
  'X_train': data['X_train'][:num_train],
  'y_train': data['y_train'][:num_train],
  'X_val': data['X_val'],
  'y_val': data['y_val'],
}

solvers = {}

for update_rule in ['sgd', 'sgd_momentum']:
  print('running with ', update_rule)
  model = FullyConnectedNet([100, 100, 100, 100, 100], weight_scale=5e-2)

  solver = Solver(model, small_data,
                  num_epochs=5, batch_size=100,
                  update_rule=update_rule,
                  optim_config={
                    'learning_rate': 1e-2,
                  },
                  verbose=True)
  solvers[update_rule] = solver
  solver.train()
  print()

for update_rule, solver in solvers.items():
  plt.subplot(3, 1, 1)
  plt.plot(solver.loss_history, 'o', label=update_rule)

  plt.subplot(3, 1, 2)
  plt.plot(solver.train_acc_history, '-o', label=update_rule)

  plt.subplot(3, 1, 3)
  plt.plot(solver.val_acc_history, '-o', label=update_rule)

for i in [1, 2, 3]:
  plt.subplot(3, 1, i)
  plt.legend(loc='upper center', ncol=4)
plt.gcf().set_size_inches(15, 15)
plt.show()

learning_rates = {'rmsprop': 1e-4, 'adam': 1e-3}
for update_rule in ['adam', 'rmsprop']:
  print('running with ', update_rule)
  model = FullyConnectedNet([100, 100, 100, 100, 100], weight_scale=5e-2)

  solver = Solver(model, small_data,
                  num_epochs=5, batch_size=100,
                  update_rule=update_rule,
                  optim_config={
                    'learning_rate': learning_rates[update_rule]
                  },
                  verbose=True)
  solvers[update_rule] = solver
  solver.train()
  print()

plt.subplot(3, 1, 1)
plt.title('Training loss')


plt.subplot(3, 1, 2)
plt.title('Training accuracy')


plt.subplot(3, 1, 3)
plt.title('Validation accuracy')


for update_rule, solver in solvers.items():
  plt.subplot(3, 1, 1)
  plt.plot(solver.loss_history, 'o', label=update_rule)

  plt.subplot(3, 1, 2)
  plt.plot(solver.train_acc_history, '-o', label=update_rule)

  plt.subplot(3, 1, 3)
  plt.plot(solver.val_acc_history, '-o', label=update_rule)

for i in [1, 2, 3]:
  plt.subplot(3, 1, i)
  plt.legend(loc='upper center', ncol=4)
plt.gcf().set_size_inches(15, 15)
plt.show()


