MPAndroidChart3使用详解4:BarChart(柱形图)
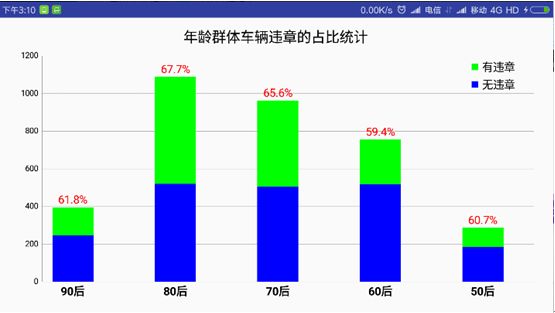
柱状图使用实例
>> 代码:
private BarChart bc;

    @Override
    protected void onCreate(Bundle savedInstanceState) {
        super.onCreate(savedInstanceState);
        setContentView(R.layout.activity_bar);
        initView();
        initData();
    }

    private void initView() {
        bc = (BarChart) findViewById(R.id.bc);
    }

    private void initData() {
//        bc.setFitBars(true);
        bc.setExtraOffsets(24f,48f,24f,24f);
        setDescription("年龄群体车辆违章的占比统计");
        setLegend();
        setYAxis();
        setXAxis();
        setChartData();
    }

    private void setDescription(String descriptionStr) {
        Description description = new Description();
        description.setText(descriptionStr);
        description.setTextSize(18f);
        description.setTextAlign(Paint.Align.CENTER); // 文本居中对齐
        // 计算描述位置
        WindowManager wm = (WindowManager) getSystemService(Context.WINDOW_SERVICE);
        DisplayMetrics outMetrics = new DisplayMetrics();
        wm.getDefaultDisplay().getMetrics(outMetrics);
        Paint paint = new Paint();
        paint.setTextSize(18f);
        paint.setTypeface(Typeface.DEFAULT_BOLD);
        float x = outMetrics.widthPixels / 2;
        float y =  Utils.calcTextHeight(paint, descriptionStr) + Utils.convertDpToPixel(24);
        description.setPosition(x, y);
        bc.setDescription(description);

    }

    private void setLegend() {
        Legend legend = bc.getLegend();
        legend.setTextSize(14f);
        legend.setXOffset(24f);
        legend.setHorizontalAlignment(Legend.LegendHorizontalAlignment.RIGHT); // 图例在水平线上向右对齐
        legend.setVerticalAlignment(Legend.LegendVerticalAlignment.TOP); // 图例在垂直线上向上对齐
        legend.setOrientation(Legend.LegendOrientation.VERTICAL); // 图例条目垂直方向排列
        legend.setDrawInside(true); // 绘制在图表内部
    }

    private void setYAxis() {
        // 左侧Y轴
        YAxis axisLeft = bc.getAxisLeft();
        axisLeft.setAxisMinimum(0); // 最小值为0
        axisLeft.setAxisMaximum(1200); // 最大值为1200
        axisLeft.setValueFormatter(new IAxisValueFormatter() { // 自定义值的格式
            @Override
            public String getFormattedValue(float value, AxisBase axis) {
                return (int) value + "";
            }
        });
        // 右侧Y轴
        bc.getAxisRight().setEnabled(false); // 不启用
    }

    private void setXAxis() {
        // X轴
        XAxis xAxis = bc.getXAxis();
        xAxis.setPosition(XAxis.XAxisPosition.BOTTOM); // 位于底部
        xAxis.setDrawGridLines(false); // 不绘制X轴网格线
        xAxis.setAxisMinimum(-0.3f); // 最小值-0.3f,为了使左侧留出点空间
        xAxis.setGranularity(1f); // 间隔尺寸1
        xAxis.setTextSize(14f); // 文本大小14
        xAxis.setTypeface(Typeface.DEFAULT_BOLD); // 加粗字体
        xAxis.setValueFormatter(new IAxisValueFormatter() { // 自定义值格式
            @Override
            public String getFormattedValue(float value, AxisBase axis) {
                return 9 - (int) value + "0后";
            }
        });
    }

    private void setChartData() {
        final List yVals1 = new ArrayList<>();
        yVals1.add(new BarEntry(0f, 396));
        yVals1.add(new BarEntry(1f, 1089));
        yVals1.add(new BarEntry(2f, 963));
        yVals1.add(new BarEntry(3f, 756));
        yVals1.add(new BarEntry(4f, 287));

        final List yVals2 = new ArrayList<>();
        yVals2.add(new BarEntry(0f, 245));
        yVals2.add(new BarEntry(1f, 520));
        yVals2.add(new BarEntry(2f, 504));
        yVals2.add(new BarEntry(3f, 517));
        yVals2.add(new BarEntry(4f, 186));

        BarDataSet barDataSet1 = new BarDataSet(yVals1, "有违章");
        barDataSet1.setValueTextColor(Color.RED);
        barDataSet1.setColor(Color.GREEN);
        barDataSet1.setValueTextSize(14f);
        barDataSet1.setValueFormatter(new IValueFormatter() {
            @Override
            public String getFormattedValue(float value, Entry entry, int dataSetIndex, ViewPortHandler viewPortHandler) {
                return new DecimalFormat("##.0").format(value / (yVals2.get((int) entry.getX()).getY() + value) * 100) + "%";
            }
        });

        BarDataSet barDataSet2 = new BarDataSet(yVals2, "无违章");
        barDataSet2.setColor(Color.BLUE);
        barDataSet2.setDrawValues(false);

        List dataSets = new ArrayList<>();
        dataSets.add(barDataSet1);
        dataSets.add(barDataSet2);

        BarData bardata = new BarData(dataSets);
        bardata.setBarWidth(0.4f);

        bc.setData(bardata);
    }
>> 效果图:
