词云python
词云
在开始接触NLP阶段,初试了文字生成的模型,从而在字符级、词级的条件下建立示例的模型。回到最基本的词的内容,通过可视化方式观察词频的情况,对前期的分析也许有些帮助。这类型的词云图,有时候作为PPT汇报的点缀也提升解释性。在此,简单记录绘制的过程,也方便后续回想。
import os
import numpy as np
np.random.seed(123)
os.environ['CUDA_VISIBLE_DEVICES'] = ""  # 设置为cpu运行

from tensorflow.keras.models import Sequential
from tensorflow.keras.layers import LSTM, RNN, Dense, Activation
from tensorflow.keras.optimizers import RMSprop,Adam

import jieba
import nltk

import matplotlib as mpl
# mpl.rcParams["font.sans-serif"] = [u"SimHei"]
# mpl.rcParams['axes.unicode_minus'] = False
import matplotlib.pyplot as plt
%matplotlib inline
myfont = mpl.font_manager.FontProperties(fname='/usr/share/fonts/opentype/noto/NotoSansCJK-Bold.ttc')
mpl.rcParams['axes.unicode_minus'] = False
数据准备
alltext = open(file='./data/excise_caixin.txt',encoding='utf-8')
alltext_use = alltext.read()  # 获取10000个字符
alltext.close()
alltext_use = alltext_use.replace('\n','').replace('\u3000', '').replace('\ufeff', '')
分词
test1 = jieba.cut(alltext_use[:200])
'/'.join(test1)
'在/近期/陆续/召开/2019/年度/工作/会上/,/电力/、/石油/、/天然气/、/铁路/、/民航/、/电信/、/军工/等/重点/领域/央企/纷纷表示/将/加快/建设/世界/一流/企业/,/在/加大/投资/力度/“/补短/板/、/稳/增长/”/的/同时/,/还/明确/了/混改/计划/,/积极/引入/社会/资本/。/业内/专家/表示/,/这/意味着/重点/领域/混改/真正/向/纵深/推进/。/打造/“/世界/一流/”/企业/十九/大/报告/提出/,/深化/国有企业/改革/,/发展/混合/所有制/经济/,/培育/具有/全球/竞争力/的/世界/一流/企业/。/《/经济/参考报/》/记者/了解/到/,/国资委/选定/航天/科'
test1 = jieba.cut(alltext_use)
alltext_use2 = '/'.join(test1).split('/')
# 句子序列构造
maxlen = 100
step = 3
sentences = []
next_chars = []
for i in range(0, len(alltext_use) - maxlen, step):
    sentences.append(alltext_use[i:i+maxlen])
    next_chars.append(alltext_use[i+maxlen])
print('nb_sequences:', len(sentences))
nb_sequences: 924
可视化与分析
参考:
Quick Recipe: Building Word Clouds
Visual Text Analytics With Python
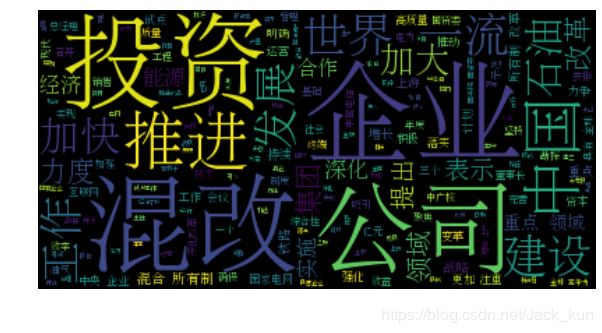
from wordcloud import WordCloud
wc = WordCloud(font_path='/usr/share/fonts/truetype/arphic/uming.ttc',max_font_size=80).generate(' '.join(alltext_use2))
# wc = WordCloud(max_font_size=60).generate(' '.join(alltext_use2))
fig = plt.figure(figsize=(10,10))
plt.imshow(wc, interpolation='bilinear')
plt.axis("off")
# plt.title(u'你好的')
plt.xlabel(u"横坐标xlabel",fontproperties=myfont)
plt.show()
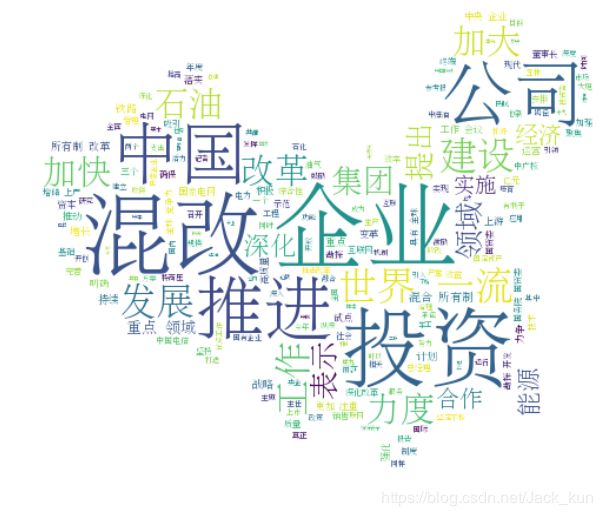
from imageio import imread

Jpg = imread('/home/iot/myapp/LQK_Files/data/linshi.jpg')
wc = WordCloud(font_path='/usr/share/fonts/truetype/arphic/uming.ttc',mask=Jpg, background_color='white',max_font_size=80).generate(' '.join(alltext_use2))
# wc = WordCloud(max_font_size=60).generate(' '.join(alltext_use2))
fig = plt.figure(figsize=(10,10))
plt.imshow(wc, interpolation='bilinear')
plt.axis("off")
# plt.title(u'你好的')
plt.xlabel(u"横坐标xlabel",fontproperties=myfont)
plt.show()
建立网络模型
help(pos_tag_sents)
Help on function pos_tag_sents in module nltk.tag:

pos_tag_sents(sentences, tagset=None, lang='eng')
    Use NLTK's currently recommended part of speech tagger to tag the
    given list of sentences, each consisting of a list of tokens.

    :param tokens: List of sentences to be tagged
    :type tokens: list(list(str))
    :param tagset: the tagset to be used, e.g. universal, wsj, brown
    :type tagset: str
    :param lang: the ISO 639 code of the language, e.g. 'eng' for English, 'rus' for Russian
    :type lang: str
    :return: The list of tagged sentences
    :rtype: list(list(tuple(str, str)))
# import seaborn as sns
# sns.set(font='YaHei Consolas Hybrid')

plt.rcParams['font.sans-serif'] = ['YaHei Consolas Hybrid']
# get all words for government corpus
corpus_genre = 'government'
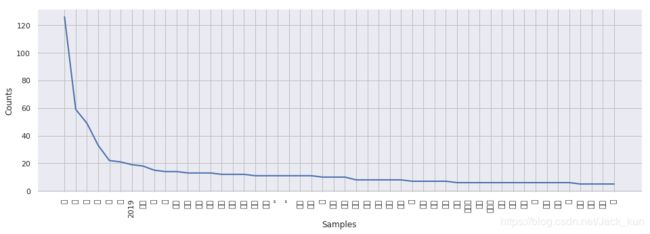
freqdist = nltk.FreqDist(alltext_use2)
plt.figure(figsize=(16,5))
freqdist.plot(50)
import pandas as pd
fd = pd.DataFrame(list(freqdist.items()), columns=['name', 'times'])
fd = fd.sort_values(by='name', ascending=False)
fd[fd['times']>5]
| name | times | |
|---|---|---|
| 161 | ; | 6 |
| 8 | , | 126 |
| 19 | 领域 | 13 |
| 87 | 集团 | 8 |
| 18 | 重点 | 11 |
| 132 | 要 | 21 |
| 51 | 表示 | 7 |
| 89 | 能源 | 6 |
| 69 | 经济 | 6 |
| 17 | 等 | 10 |
| 11 | 石油 | 8 |
| 37 | 的 | 33 |
| 42 | 混改 | 13 |
| 67 | 混合 | 6 |
| 63 | 深化 | 7 |
| 135 | 更加 | 6 |
| 65 | 改革 | 13 |
| 62 | 提出 | 7 |
| 57 | 推进 | 11 |
| 29 | 投资 | 12 |
| 68 | 所有制 | 6 |
| 24 | 建设 | 10 |
| 110 | 年 | 22 |
| 6 | 工作 | 14 |
| 22 | 将 | 7 |
| 204 | 实施 | 6 |
| 0 | 在 | 14 |
| 80 | 国资委 | 6 |
| 114 | 和 | 15 |
| 140 | 合作 | 6 |
| 66 | 发展 | 10 |
| 283 | 勘探 | 6 |
| 23 | 加快 | 8 |
| 28 | 加大 | 8 |
| 30 | 力度 | 8 |
| 122 | 公司 | 12 |
| 27 | 企业 | 18 |
| 84 | 中国 | 11 |
| 25 | 世界 | 12 |
| 516 | 与 | 6 |
| 26 | 一流 | 11 |
| 48 | 。 | 49 |
| 10 | 、 | 59 |
| 36 | ” | 11 |
| 31 | “ | 11 |
| 4 | 2019 | 19 |
训练与检查
alltext_use.count('公司')
15
from nltk import FreqDist
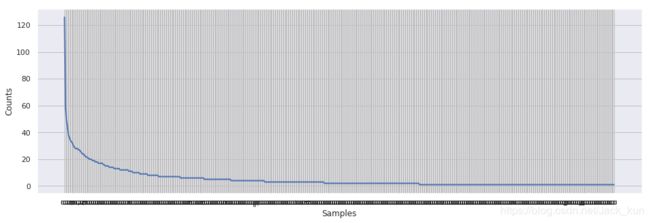
plt.figure(figsize=(16,5))

fdist = FreqDist(alltext_use)
fdist.plot()
上面还存在一个问题:ubuntu服务器环境中如何正确显示中文标题?(如上文,已经通过常见的中文显示设置,均无效)


