R入门(九)--- 地图
地图
- 下载文件,数据依次是经度,维度和洲名
download.file(url = 'http://dapengde.com/r4rookies/us.csv',
              destfile ='F:/R lab/学R/r4r/us.csv' )
为什么我用download.file(),按下F1没反应呢?
- 只能对最外圈的函数,F1才会显示帮助文件
download.file(url = 'http://dapengde.com/r4rookies/us.csv',
              destfile ='F:/R lab/学R/r4r/us.csv' )
us <- read.csv('F:/R lab/学R/r4r/us.csv')
nlevels(us$state)  #49个洲
 #给洲画个大致雏形
plot(us$lon,us$lat)  #居然这么简单就把图形画出来了
points(us$lon[us$state == 'Texas'],
       us$lat[us$state == 'Texas'], col = 'blue')
cols <- rainbow(nlevels(us$state)) #给洲涂上彩虹色
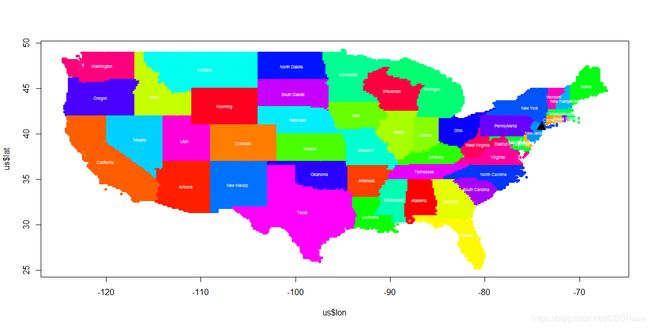
plot(us$lon,us$lat,col = cols[us$state], pch = 20) #无与伦比的美丽地图
 #给洲添加名称,
lon.median <- tapply(us$lon,us$state,median)
lat.median <- tapply(us$lat,us$state,median)
text(labels = levels(us$state), x = lon.median, y = lat.median,
     cex = 0.5, col = 'White')
points(-74.02, 40.73, pch = 17, cex = 2)
- tapply()函数 针对某组别的某个对象进行某项操作
tapply(对象,组别,操作)
课后作业
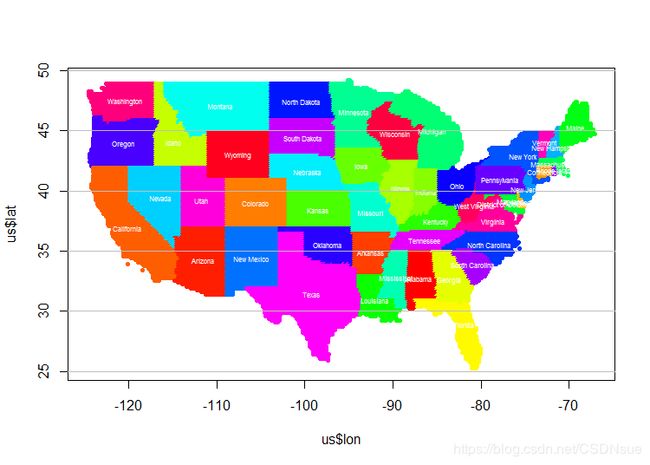
- 标出每隔五度的纬度,并且找出北纬35度穿过哪些洲
> us <- read.csv('F:/R lab/学R/r4r/us.csv')
> plot(us$lon,us$lat)
> cols <- rainbow(nlevels(us$state))
> plot(x = us$lon, y = us$lat, col = cols[us$state], pch = 20)
> lon.median <- tapply(us$lon,us$state,median)
> lat.median <- tapply(us$lat,us$state,median)
> text(labels = levels(us$state), x = lon.median, y = lat.median,
+      cex = 0.5, col = 'White')
> abline(h = seq(from = 25, to = 50, by = 5),col = 'grey')
> unique(us$state[us$lat > 34.9 & us$lat < 35.1])
 [1] California     Arizona        New Mexico     Texas          Oklahoma
 [6] Arkansas       Tennessee      North Carolina South Carolina Mississippi
[11] Alabama        Georgia
49 Levels: Alabama Arizona Arkansas California Colorado Connecticut ... Wyoming
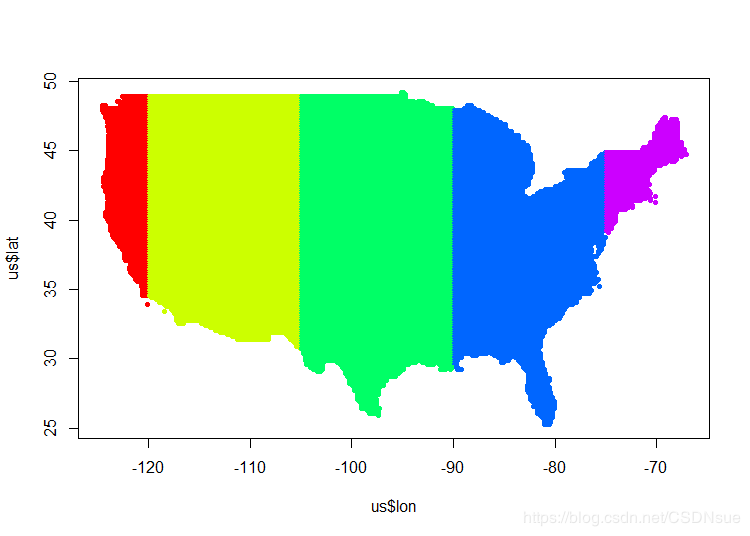
timez <- as.factor(us$lon %/% 15)  #将经度按照每15度来划分,取其商部分
mycol <- rainbow(nlevels(timez))[timez]  #根据商的取值来分色
plot(us$lon,us$lat, col=mycol,pch = 20)
绘制矢量地图
- 从大鹏的网上下载数据,shape格式的地图文件
- 用R就能解压缩,好不痛快,哈哈哈哈,开心unzip()
#矢量地图
download.file(url = 'http://dapengde.com/r4rookies/cm.zip',
              destfile ='F:/R lab/学R/r4r/cm.zip' )
unzip(zipfile = 'F:/R lab/学R/r4r/cm.zip',exdir = 'F:/R lab/学R/r4r')
- 读取cm文件夹里面的文件,需要加载安装包rgdal,因此如果没有的话,需要下载,并加载
require(rgdal)
cm <- readOGR(dsn = 'F:/R lab/学R/r4r/cm',layer = 'bou2_4p')
- readOGR()是读取地图文件,dsn是数据文件夹名称,全称为data source name,指定地图文件所在文件夹路径,末尾没有斜线符号,layer是要读取的地图文件名,没有扩展名
- 然后就是画图啦
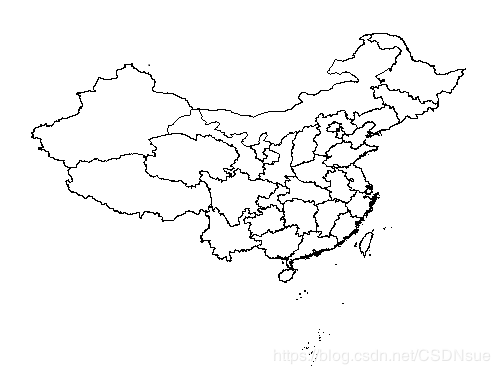
plot(cm)
-
查看省市名称,下载空气污染数据
-
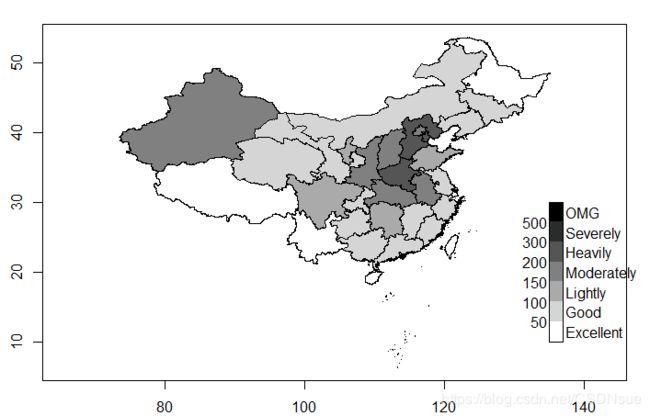
根据污染的情况对严重程度进行评级
- 先设定评级标准,优良中差的范围,代码中用aqstandard变量表示
- 用cut()函数来对数据进行级别判定,语法为–>cut(待判断的数据, 判断标准节点)
- 另外, 由于cm中省份(NAME)顺序, 和aqi中省份(province)顺序不同,因此用match(函数进行匹配),语法为–>match(参照的数据, 待排序的数据),返回的结果是,‘待排序的数据’ 按照 ‘参照数据’ 进行的排序数字
summary(cm)
is.factor(cm$NAME)
levels(cm$NAME) #查看省市名称
 #下载空气数据
download.file(url = 'http://dapengde.com/r4rookies/aqi.csv',
              destfile ='F:/R lab/学R/r4r/aqi.csv' )
aqi <- read.csv('F:/R lab/学R/r4r/aqi.csv')
head(aqi)
 #对空气质量进行分级
aqstandard <- c(0,50,100,150,200,300,500,Inf)
aqilevel <- cut(aqi$aqi[match(levels(cm$NAME),aqi$province)],
                aqstandard)  #将aqi省份按照cm中的顺序排列后, 表明其所属空气质量范围,左开右闭区间
 #将颜色按照实际空气质量所涵盖的级别多少, 用相应个数的灰度显示
mycol <- grey(seq(1, 0,
                  length.out = nlevels(aqilevel)))[aqilevel]
col <- cm$NAME
levels(col) <- mycol
plot(cm ,col = as.character(factor(col)), axes = TRUE)
 #用plotrix包给地图添加漂亮的图例
library(plotrix)
legendn <- character((length(aqstandard) - 2) * 2 + 1)
legendn[seq(2, length(legendn), by = 2)] <-
  aqstandard[2:(length(aqstandard)-1)]
color.legend(
  xl = 135,yb = 10,xr = 137,yt = 30,legend = legendn,
  rect.col = grey(seq(1,0,length.out = nlevels(aqilevel))),
  align = 'lb',gradient = 'y'  #添加图例
)
color.legend(
  xl = 135,yb = 10,xr = 137,yt = 30,
  legend = c('Excellent','Good','Lightly','Moderately','Heavily','Severely','OMG'),
  rect.col = grey(seq(1,0,length.out = nlevels(aqilevel))),
  align = 'rb',gradient = 'y'  #添加图例
)
> plot(cm)
> aqi <- read.csv('F:/R lab/学R/r4r/aqi.csv')
> #对空气质量进行分级
> aqstandard <- c(0,50,100,150,200,300,500,Inf)
> aqilevel <- cut(aqi$aqi[match(levels(cm$NAME),aqi$province)],
+                 aqstandard)
> #将颜色按照实际空气质量所涵盖的级别多少, 用相应个数的灰度显示
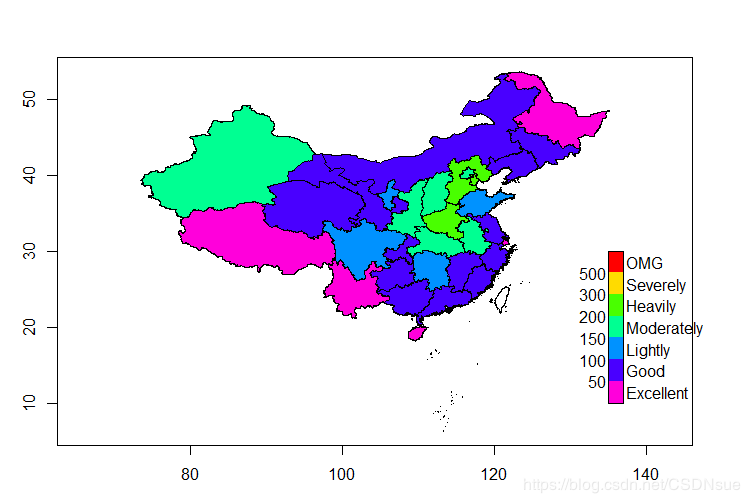
> mycol <- rev(rainbow(nlevels(aqilevel)))[aqilevel]
> col <- cm$NAME
> levels(col) <- mycol
> plot(cm ,col = as.character(factor(col)), axes = TRUE)
> #用plotrix包给地图添加漂亮的图例
> library(plotrix)
> legendn <- character((length(aqstandard) - 2) * 2 + 1)
> legendn[seq(2, length(legendn), by = 2)] <-
+   aqstandard[2:(length(aqstandard)-1)]
> color.legend(
+   xl = 135,yb = 10,xr = 137,yt = 30,legend = legendn,
+   rect.col = rev(rainbow(nlevels(aqilevel))),
+   align = 'lb',gradient = 'y'  #添加图例
+ )
> color.legend(
+   xl = 135,yb = 10,xr = 137,yt = 30,
+   legend = c('Excellent','Good','Lightly','Moderately','Heavily','Severely','OMG'),
+   rect.col = rev(rainbow(nlevels(aqilevel))),
+   align = 'rb',gradient = 'y'  #添加图例
+ )
太复杂, 需得好好研究
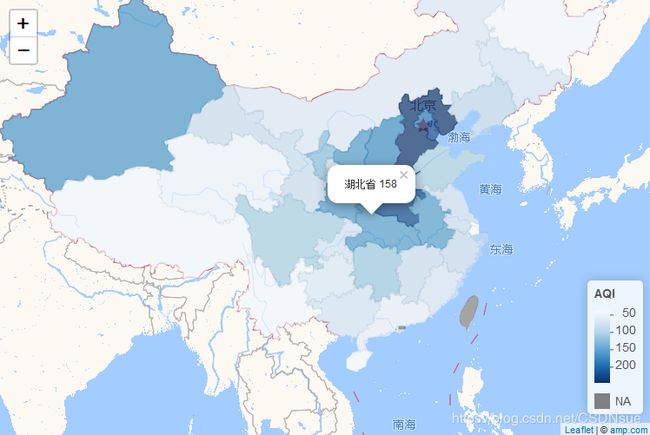
交互地图
#交互地图
require(leafletCN)
aqi$aqi[aqi$aqi == -1] <- NA
pvs <- regionNames('china')
loc <- match(pvs, aqi$province)
aqi2 <- data.frame(name = pvs, value = aqi$aqi[loc])

#交互最后一击
geojsonMap(dat = aqi2,mapName = 'china',
           popup = paste(aqi2$name, aqi2$value),
           legendTitle = 'AQI')
- sad,保存出来的就定型了,emmmm
