- 网卡流量
1、iftop命令
iftop可以用来监控网卡的实时流量(可以指定网段)、反向解析IP、显示端口信息、TCP/IP连接等
官网:http://www.ex-parrot.com/~pdw/iftop/
- 安装iftop:
[root@Super ~]# yum install flex byacc  libpcap ncurses ncurses-devel libpcap-devel -y
[root@Super ~]# wget http://www.ex-parrot.com/~pdw/iftop/download/iftop-0.17.tar.gz
[root@Super ~]#  tar -zxvf iftop-0.17.tar.gz
[root@Super ~]# cd iftop-0.17
[root@Super iftop-0.17]#    ./configure
[root@Super iftop-0.17]# make
[root@Super iftop-0.17]# make install
[root@Super iftop-0.17]# iftop --help
iftop: unknown option --
iftop: display bandwidth usage on an interface by host

Synopsis: iftop -h | [-npbBP] [-i interface] [-f filter code] [-N net/mask]

   -h                  display this message
   -n                  don't do hostname lookups
   -N                  don't convert port numbers to services
   -p                  run in promiscuous mode (show traffic between other
                       hosts on the same network segment)
   -b                  don't display a bar graph of traffic
   -B                  Display bandwidth in bytes
   -i interface        listen on named interface
   -f filter code      use filter code to select packets to count
                       (default: none, but only IP packets are counted)
   -F net/mask         show traffic flows in/out of network
   -P                  show ports as well as hosts
   -m limit            sets the upper limit for the bandwidth scale
   -c config file      specifies an alternative configuration file

iftop, version 0.17
copyright (c) 2002 Paul Warren  and contributors
[root@Super iftop-0.17]#
或者安装好epel源后直接yum install iftop -y安装
- 运行iftop
直接运行后效果图如下
[root@Super soft]# iftop
interface: ens32
IP address is: 192.168.100.127
MAC address is: 00:50:56:a9:1c:49
[root@Super soft]# 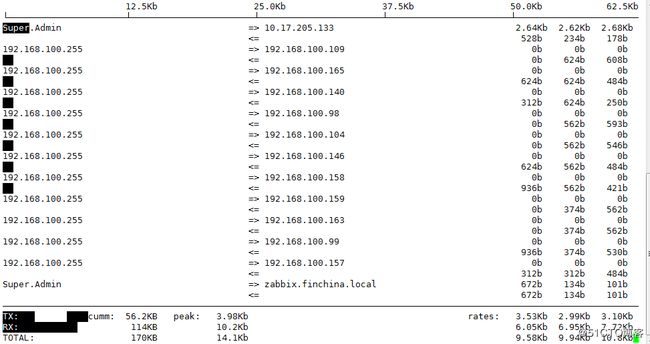
<= 、=> 左右箭头,表示流量的方向;
右边3列,表示的是该访问ip连接到本机2秒,10秒和40秒的平均流量
TX:发送流量
RX:接收流量
TOTAL:总流量
Cumm:运行iftop到目前时间的总流量
peak:流量峰值
rates:分别表示过去 2s 10s 40s 的平均流量
- iftop常用的参数
-i:设定监测的网卡,如:# iftop -i eth1
-B:以bytes为单位显示流量(默认是bits),如:# iftop -B
-n:使host信息默认直接都显示IP,如:# iftop -n
-N:使端口信息默认直接都显示端口号,如: # iftop -N
-F:显示特定网段的进出流量,如# iftop -F 10.10.1.0/24或# iftop -F 10.10.1.0/255.255.255.0
-h:(display this message),帮助,显示参数信息
-p:使用这个参数后,中间的列表显示的本地主机信息,出现了本机以外的IP信息;
-b:使流量图形条默认就显示;
-f:过滤计算包;
-P:使host信息及端口信息默认就都显示;
-m:设置界面最上边的刻度的最大值,刻度分五个大段显示,例:# iftop -m 100M
- iftop界面常用命令(区分大小写)
h:切换是否显示帮助;
n:切换显示本机的IP或主机名;
s:切换是否显示本机的host信息;
d:切换是否显示远端目标主机的host信息;
t:来往的数据合并成一行,切换显示格式为2行/1行/只显示发送流量/只显示接收流量;
N:切换显示端口号或端口服务名称;
S:切换是否显示本机的端口信息;
D:切换是否显示远端目标主机的端口信息;
p:切换是否显示端口信息;
P:切换暂停/继续显示;
b:切换是否显示平均流量图形条;
B:切换计算2秒或10秒或40秒内的平均流量;
T:切换是否显示每个连接的总流量;
l:打开屏幕过滤功能,输入要过滤的字符,比如ip,按回车后,屏幕就只显示这个IP相关的流量信息;
L:切换显示画面上边的刻度;刻度不同,流量图形条会有变化;
j或k:可以向上或向下滚动屏幕显示的连接记录;
1或2或3:可以根据右侧显示的三列流量数据进行排序;
<:根据左边的本机名或IP排序;
“>:”根据远端目标主机的主机名或IP排序
o:切换是否固定只显示当前的连接;
f:可以编辑过滤代码,这是翻译过来的说法,我还没用过这个!
!:可以使用shell命令,这个没用过!没搞明白啥命令在这好用呢!
q:退出监控。
2、iptraf命令
iptraf是一款交互式、色彩鲜艳的IP局域网监控工具。它可以显示每个连接以及主机之间传输的数据量。以生成各种网络统计数据,包括TCP信息、UDP统计、ICMP和OSPF信息、以太网负载信息、节点统计、IP校验和错误和其它一些信息。
[root@localhost ~]# yum install -y epel-release
[root@localhost ~]# yum install iptraf-ng -y
-i iface 网络接口:立即在指定网络接口上开启IP流量监视,iface为all指监视所有的网络接口,iface指相应的interface
-g 立即开始生成网络接口的概要状态信息
-d iface 网络接口:在指定网络接口上立即开始监视明细的网络流量信息,iface指相应的interface
-s iface 网络接口:在指定网络接口上立即开始监视TCP和UDP网络流量信息,iface指相应的interface
-z iface 网络接口:在指定网络接口上显示包计数,iface指相应的interface
-l iface 网络接口:在指定网络接口上立即开始监视局域网工作站信息,iface指相应的interface
-t timeout 时间:指定iptraf指令监视的时间,timeout指监视时间的minute数
-B 将标注输出重新定向到“/dev/null”,关闭标注输入,将程序作为后台进程运行
-L logfile 指定一个文件用于记录所有命令行的log,默认文件是地址:/var/log/iptraf
-I interval 指定记录log的时间间隔(单位是minute),不包括IP traffic monitor
-u 允许使用不支持的接口作为以太网设备
-f 清空所有计数器
-h 显示帮助信息
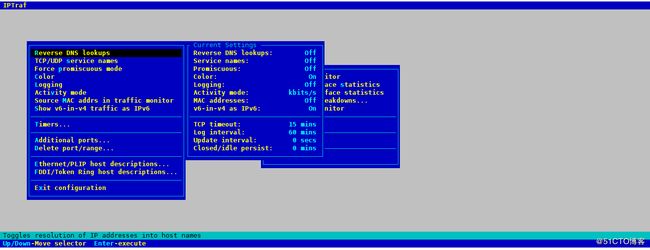
- Configure
在总菜单命令中点击“Configure” menu,即进入如上命令菜单,进行适当的配置可以让统计的结果更直观,信息更丰富。
1)Reverse DNS lookups:查看连接的ip所对应的域名,在IP traffic monitor的pkt captured对话框中就可以看到域名结果,这个不是很直观,开启后会有点点影响抓包性能。
2)TCP/UDP service names:在有端口的地方都会把端口号换成相应的服务名,非常有用,很直观。
3)Activity mode:显示流量是按Kbits/s还是Kbytes/s,建议改成后面的更符合习惯。
4)Additional ports:按端口号监控所额外需要监控的端口,默认只监控小于1024的。
- Filters
这个默认就行了,除非有特殊需要。
- IP traffic monitor
根据连接查看网络流量,这个最好让他跑一段时间看统计总量的结构,如果单个连接占用大量带宽,就很容易看出来。同时根据IP还可以很容易分辨是和内网还是外网服务器进行交互。pkt captured可以看到mac地址。
3、sar命令
-
sar(System Activity Reporter系统活动情况报告)是目前 Linux 上最为全面的系统性能分析工具之一,可以从多方面对系统的活动进行报告,包括:文件的读写情况、系统调用的使用情况、磁盘I/O、CPU效率、内存使用状况、进程活动及IPC有关的活动等。
- sar命令包含在sysstat工具包中,提供系统的众多统计数据。其在不同的系统上命令有些差异,某些系统提供的sar支持基于网络接口的数据统计,也可以查看设备上每秒收发包的个数和流量。
[root@Super soft]# which sar
/usr/bin/which: no sar in (/usr/local/sbin:/usr/local/bin:/sbin:/bin:/usr/sbin:/usr/bin:/opt/soft/node-v6.10.2-linux-x64/bin/node:/root/bin)
[root@Super soft]# yum -y install sysstat
[root@Super soft]# which sar
/bin/sar
[root@Super soft]# sar -n DEV 1 2
Linux 3.10.0-693.21.1.el7.x86_64 (Super.Admin)  08/11/2018  _x86_64_    (16 CPU)

04:54:14 PM     IFACE   rxpck/s   txpck/s    rxkB/s    txkB/s   rxcmp/s   txcmp/s  rxmcst/s
04:54:15 PM     ens32     18.00      2.00      1.45      0.12      0.00      0.00      0.00
04:54:15 PM        lo      0.00      0.00      0.00      0.00      0.00      0.00      0.00
04:54:15 PM   docker0      0.00      0.00      0.00      0.00      0.00      0.00      0.00

04:54:15 PM     IFACE   rxpck/s   txpck/s    rxkB/s    txkB/s   rxcmp/s   txcmp/s  rxmcst/s
04:54:16 PM     ens32     15.00      3.00      1.44      0.60      0.00      0.00      0.00
04:54:16 PM        lo      0.00      0.00      0.00      0.00      0.00      0.00      0.00
04:54:16 PM   docker0      0.00      0.00      0.00      0.00      0.00      0.00      0.00

Average:        IFACE   rxpck/s   txpck/s    rxkB/s    txkB/s   rxcmp/s   txcmp/s  rxmcst/s
Average:        ens32     16.50      2.50      1.45      0.36      0.00      0.00      0.00
Average:           lo      0.00      0.00      0.00      0.00      0.00      0.00      0.00
Average:      docker0      0.00      0.00      0.00      0.00      0.00      0.00      0.00
[root@Super soft]#
1 2 表示:间隔时间(秒)、次数,即每一秒钟取1次值,取2次。
-n参数有6个开关:
DEV:显示网络接口信息。
EDEV:显示关于网络错误的统计数据。
NFS:统计活动的NFS客户端的信息。
NFSD:统计NFS服务器的信息
SOCK:显示套接字信息
ALL:显示所有5个开关
IFACE:LAN接口
rxpck/s:每秒钟接收的数据包
txpck/s:每秒钟发送的数据包
rxbyt/s:每秒钟接收的字节数
txbyt/s:每秒钟发送的字节数
rxcmp/s:每秒钟接收的压缩数据包
txcmp/s:每秒钟发送的压缩数据包
rxmcst/s:每秒钟接收的多播数据包
rxerr/s:每秒钟接收的坏数据包
txerr/s:每秒钟发送的坏数据包
coll/s:每秒冲突数
rxdrop/s:因为缓冲充满,每秒钟丢弃的已接收数据包数
txdrop/s:因为缓冲充满,每秒钟丢弃的已发送数据包数
txcarr/s:发送数据包时,每秒载波错误数
rxfram/s:每秒接收数据包的帧对齐错误数
rxfifo/s:接收的数据包每秒FIFO过速的错误数
txfifo/s:发送的数据包每秒FIFO过速的错误数
- 实时监控脚本
[root@Super soft]# cat net.sh
#!/bin/bash
export LANG="en_US.UTF-8"
#export LANG="zh_CN.UTF8"
source /etc/rc.d/init.d/functions
[ -f /etc/profile ] && . /etc/profile
[ -f ~/.bash_profile ] && . ~/.bash_profile
ethn=$1
while true
do
 RX_pre=$(cat /proc/net/dev | grep $ethn | sed 's/:/ /g' | awk '{print $2}')
 TX_pre=$(cat /proc/net/dev | grep $ethn | sed 's/:/ /g' | awk '{print $10}')
 sleep 1
 RX_next=$(cat /proc/net/dev | grep $ethn | sed 's/:/ /g' | awk '{print $2}')
 TX_next=$(cat /proc/net/dev | grep $ethn | sed 's/:/ /g' | awk '{print $10}')

 clear
 echo -e "time \tInterface\t RX   \t   TX"

 RX=$((${RX_next}-${RX_pre}))
 TX=$((${TX_next}-${TX_pre}))

 if [[ $RX -lt 1024 ]];then
 RX="${RX}B/s"
 elif [[ $RX -gt 1048576 ]];then
 RX=$(echo $RX | awk '{print $1/1048576 "MB/s"}')
 else
 RX=$(echo $RX | awk '{print $1/1024 "KB/s"}')
 fi

 if [[ $TX -lt 1024 ]];then
 TX="${TX}B/s"
 elif [[ $TX -gt 1048576 ]];then
 TX=$(echo $TX | awk '{print $1/1048576 "MB/s"}')
 else
 TX=$(echo $TX | awk '{print $1/1024 "KB/s"}')
 fi

 echo -e "`date +%k:%M:%S` $ethn\t\t$RX $TX"
done
[root@Super soft]# ./net.sh ens32
time    Interface    RX        TX
17:16:29 ens32      1.1543KB/s 254B/s
time    Interface    RX        TX
17:16:30 ens32      1.03711KB/s 0B/s
脚本是通过读取运行时文件系统/proc/net/dev中的网络实时数据,并通过简单计算得到的。
Linux 内核提供了一种通过 /proc 文件系统,在运行时访问内核内部数据结构、改变内核设置的机制。proc文件系统是一个伪文件系统,它只存在内存当中,而不占用外存空间。它以文件系统的方式为访问系统内核数据的操作提供接口。用户和应用程序可以通过proc得到系统的信息,并可以改变内核的某些参数。由于系统的信息,如进程,是动态改变的,所以用户或应用程序读取proc文件时,proc文件系统是动态从系统内核读出所需信息并提交的。/proc文件系统中包含了很多目录,其中/proc/net/dev 保存了网络适配器及统计信息。
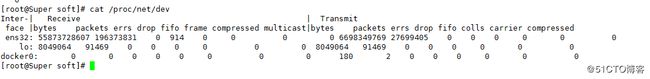
Receive表示收包,
Transmit表示发送包
bytes表示收发的字节数;
packets表示收发正确的包量;
errs表示收发错误的包量;
drop表示收发丢弃的包量;
4、nload命令
查看总带宽使用情况,可以分开来监控入站流量和出站流量。它还可以绘制图表以显示入站流量和出站流量,视图比例可以调整。用起来很简单,不支持许多选项。
CentOS需要从Epel软件库获得nload。
[root@localhost ~]# yum install -y epel-release
[root@localhost ~]# yum install nload -y
[root@localhost ~]# nload -h

nload version 0.7.4
Copyright (C) 2001 - 2012 by Roland Riegel
nload comes with ABSOLUTELY NO WARRANTY. This is free software, and you are
welcome to redistribute it under certain conditions. For more details see the
GNU General Public License Version 2 (http://www.gnu.org/copyleft/gpl.html).

Command line syntax:
nload [options] [devices]
nload --help|-h

Options:
-a period       Sets the length in seconds of the time window for average
                calculation.
                Default is 300.    #平均计算时间长度
-i max_scaling  Specifies the 100% mark in kBit/s of the graph indicating the
                incoming bandwidth usage. Ignored if max_scaling is 0 or the
                switch -m is given.
                Default is 10240.    #指定入口流量最大值 单位是kBit/s
-m              Show multiple devices at a time; no traffic graphs.   #同时显示多个设备统计信息
-o max_scaling  Same as -i but for the graph indicating the outgoing bandwidth
                usage.
                Default is 10240.   #和-i相同,但是是出口流量
-t interval     Determines the refresh interval of the display in milliseconds.
                Default is 500.    #刷新间隔,单位是毫秒,
-u h|b|k|m|g    Sets the type of unit used for the display of traffic numbers.
   H|B|K|M|G    h: auto, b: Bit/s, k: kBit/s, m: MBit/s etc.
                H: auto, B: Byte/s, K: kByte/s, M: MByte/s etc.
                Default is h.    #设置右边Curr、Avg、Min、Max的数据单位,默认是自动变的.注意大小写单位不同!
-U h|b|k|m|g    Same as -u, but for a total amount of data (without "/s").
   H|B|K|M|G    Default is H.    #和-u相同,但是为总流量
devices         Network devices to use.
                Default is to use all auto-detected devices.    # 指定网卡,默认是全部监控的,使用左右键切换。
--help
-h              Print this help.

example: nload -t 200 -i 1024 -o 128 -U M

The options above can also be changed at run time by pressing the 'F2' key.     #运行时使用F2可以查看此页

[root@localhost ~]#
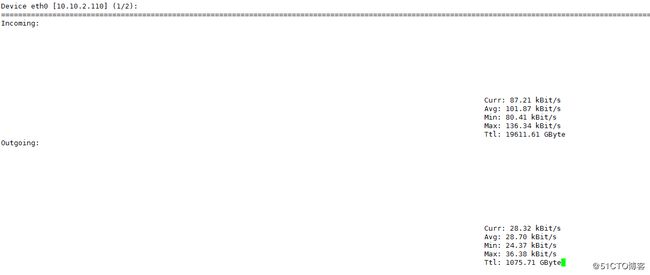
当前流量(Curr),平均流量(Avg),最小流量(Min),最大流量(Max),总和流量(Ttl)
进程的流量
1、nethogs命令
nethogs用来按进程或程序实时统计网络带宽使用率,不依赖内核中的模块。可以显示每个进程所使用的带宽,并对列表排序,将耗用带宽最多的进程排在最上面。yum安装NetHogs需要配置EPEL源,或者https://sourceforge.net/projects/nethogs/ 下载
[root@Super ~]# yum install -y epel-release
[root@Super ~]# yum install libpcap nethogs -y
[root@Super ~]# nethogs --help
nethogs: invalid option -- '-'
usage: nethogs [-V] [-h] [-b] [-d seconds] [-v mode] [-c count] [-t] [-p] [-s] [device [device [device ...]]]
        -V : prints version.
        -h : prints this help.
        -b : bughunt mode - implies tracemode.
        -d : delay for update refresh rate in seconds. default is 1.    #刷新时间,单位秒,默认1秒
        -v : view mode (0 = KB/s, 1 = total KB, 2 = total B, 3 = total MB). default is 0.
        -c : number of updates. default is 0 (unlimited).
        -t : tracemode.       #跟踪模式
        -p : sniff in promiscious mode (not recommended).
        -s : sort output by sent column.
   -a : monitor all devices, even loopback/stopped ones.
        device : device(s) to monitor. default is all interfaces up and running excluding loopback    #监听的设备,默认是eth0,也就是网卡设备名称

When nethogs is running, press:
 q: quit
 s: sort by SENT traffic     #按send进行排序
 r: sort by RECEIVE traffic   #按received进行排序
 m: switch between total (KB, B, MB) and KB/s mode   #按 m 键,切换单位或显示进程占用速度或已统计使用的流量。切换顺序是KB/sec->KB->B->MB
[root@Super ~]#
源码方式安装:
yum install gcc-c++ libpcap-devel.x86_64 libpcap.x86_64 ncurses*
git clone https://github.com/raboof/nethogs
cd nethogs/
make
make install
- 直接运行nethogs 就可以查看当前占用带宽的进程
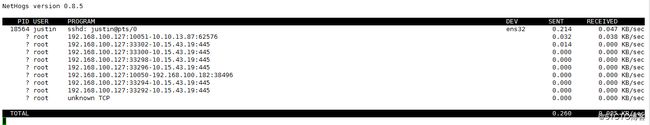
PID(进程ID),运行该进程的用户,命令行或程序,流量将要去往网络接口,发送的字节数,接收的字节数
知道PID和端口后,通过 lsof -i:port 或 ps aux|grep PID就可以知道是哪个进程。
- 监视设备(eth0)的网络带宽
[root@Super ~]# nethogs eth0- 同时监视eth0和eth1接口
[root@Super ~]# nethogs eth0 eth1