Python机器学习库sklearn里利用决策树模型进行回归分析的原理
决策树的相关理论参考http://blog.csdn.net/cymy001/article/details/78027083
#原数据网址变了,新换的数据地址需要处理http://lib.stat.cmu.edu/datasets/boston
import pandas as pd
import numpy as np
#df = pd.read_csv('http://lib.stat.cmu.edu/datasets/boston',header=19,sep='\s{1,3}')
#df.head()
dfnp=np.genfromtxt('boston.txt')
df=pd.DataFrame(dfnp,columns = ['CRIM', 'ZN', 'INDUS', 'CHAS', 'NOX', 'RM', 'AGE', 'DIS', 'RAD', 'TAX', 'PTRATIO', 'B', 'LSTAT', 'MEDV'])
df.to_csv('boston.csv')
df.head()
import numpy
import matplotlib.pyplot as plt
from sklearn.tree import DecisionTreeRegressor
#http://scikit-learn.org/stable/modules/generated/sklearn.tree.DecisionTreeRegressor.html#sklearn.tree.DecisionTreeRegressor
def lin_regplot(X, y, model):
    plt.scatter(X, y, c='lightblue')
    plt.plot(X, model.predict(X), color='red', linewidth=2)
    return

X = df[['LSTAT']].values
y = df['MEDV'].values

tree = DecisionTreeRegressor(max_depth=3)   #max_depth设置树深
tree.fit(X, y)   #参考官网attributes部分了解建模后得到的各种属性:树,使用的特征及特征重要性

sort_idx = X.flatten().argsort()   #X中最小元素到最大元素的索引构成的向量

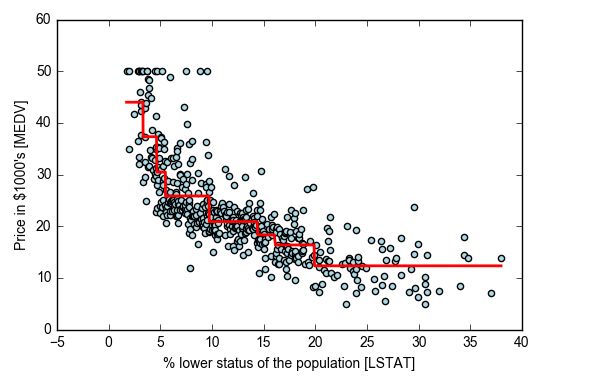
lin_regplot(X[sort_idx], y[sort_idx], tree)
plt.xlabel('% lower status of the population [LSTAT]')
plt.ylabel('Price in $1000\'s [MEDV]')
# plt.savefig('./figures/tree_regression.png', dpi=300)
plt.show()
#水平红线表示c值,竖直红线表示特征列选择的切分点
#原理验证及回归树图的线解释
X = df[['LSTAT']].values
y = df['MEDV'].values

tree = DecisionTreeRegressor(max_depth=3)   #max_depth设置树深
tree.fit(X, y)
sort_idx = X.flatten().argsort()

print(X[sort_idx][:20])#排序后特征序列值
print(tree.predict(X[sort_idx])[:20])   #查看模型tree的系数y=sum(c I(x
#Output:
[[ 1.73]
[ 1.92]
[ 1.98]
[ 2.47]
[ 2.87]
[ 2.88]
[ 2.94]
[ 2.96]
[ 2.97]
[ 2.98]
[ 3.01]
[ 3.11]
[ 3.11]
[ 3.13]
[ 3.16]
[ 3.16]
[ 3.26]
[ 3.32] #第一条竖直红线位置
[ 3.33]
[ 3.53]]
[ 43.98888889 43.98888889 43.98888889 43.98888889 43.98888889
43.98888889 43.98888889 43.98888889 43.98888889 43.98888889
43.98888889 43.98888889 43.98888889 43.98888889 43.98888889
43.98888889 43.98888889 43.98888889 37.315625 37.315625 ] #第一条水平红线位置43.98888889,第二条水平红线位置37.315625
43.9888888889本文的情况比较特殊,实验时只有一个特征列,所以在特征切分前,并没有特征维度的最优选择遍历过程。
