Python机器学习库sklearn构造分段与多项式特征
组合特征
A&B
x => x^2 x^3 X^4…
红色 蓝色 紫色 黄色
[1,0,0,0]
S, M, L, XL, XXL, XXXL
[1,0,0,0,0,0]
#mglearn包里的make_wave函数
import numpy as np
def make_wave(n_samples=100):
    rnd = np.random.RandomState(42)
    x = rnd.uniform(-3, 3, size=n_samples)   #np.random.uniform生成100个随机数,符合U(-3,3)上的均匀分布
    y_no_noise = (np.sin(4 * x) + x)
    y = (y_no_noise + rnd.normal(size=len(x))) / 2   np.random.normal
    #生成100个随机数,符合N(0,1)正态分布
    return x.reshape(-1, 1), y   #返回关于x的列向量
%matplotlib inline
from preamble import *
from sklearn.linear_model import LinearRegression
from sklearn.tree import DecisionTreeRegressor
X, y = mglearn.datasets.make_wave(n_samples=100)
#利用mglearn包里的函数制作数据集
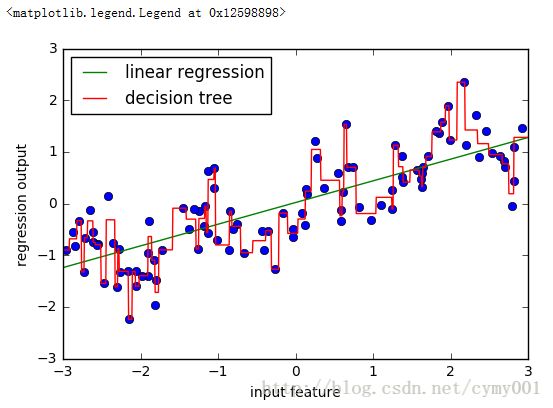
plt.plot(X[:, 0], y, 'o')
line = np.linspace(-3, 3, 1000)[:-1].reshape(-1, 1) #列向量
reg = LinearRegression().fit(X, y)
plt.plot(line, reg.predict(line), label="linear regression")
reg = DecisionTreeRegressor(min_samples_split=3).fit(X, y) #min_samples_split参数指定树内点分裂至少要有3个样本点
plt.plot(line, reg.predict(line), label="decision tree")
plt.ylabel("regression output")
plt.xlabel("input feature")
plt.legend(loc="best")np.set_printoptions(precision=2)
#np.set_printoptions设置数组打印信息,precision设置输出浮点数精度
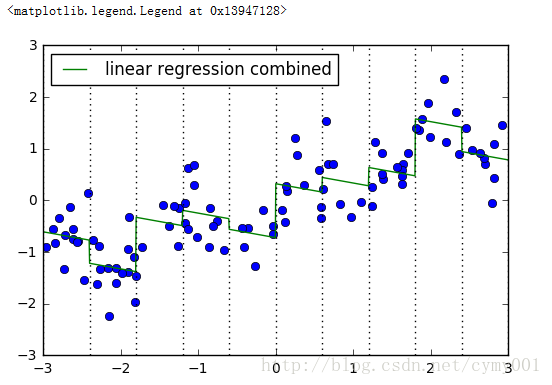
bins = np.linspace(-3, 3, 11) #构造连续特征切割分桶边界
which_bin = np.digitize(X, bins=bins) #np.digitize返回参数数组对应分桶的索引
from sklearn.preprocessing import OneHotEncoder
# transform using the OneHotEncoder.
encoder = OneHotEncoder(sparse=False) #sparse参数设置为True,使输出为系数矩阵形式;否则为数组
# encoder.fit finds the unique values that appear in which_bin
encoder.fit(which_bin) #根据索引数组,one-hot成稀疏矩阵
# transform creates the one-hot encoding
X_binned = encoder.transform(which_bin) #X_binned是one-hot变换后的训练数据集
line_binned = encoder.transform(np.digitize(line, bins=bins)) #line_binned是one-hot变换后的测试数据集X_combined = np.hstack([X, X_binned]) #组合训练数据集
print(X_combined.shape)
#Output:
#(100, 11)import matplotlib.pyplot as plt
plt.plot(X[:, 0], y, 'o')
reg = LinearRegression().fit(X_combined, y)
line_combined = np.hstack([line, line_binned]) #组合测试数据集
plt.plot(line, reg.predict(line_combined), label='linear regression combined')
for bin in bins:
plt.plot([bin, bin], [-3, 3], ':', c='k')
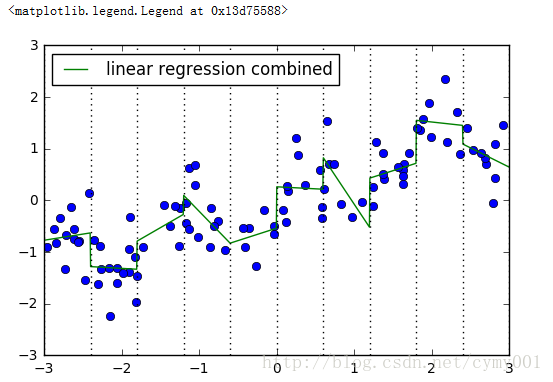
plt.legend(loc="best")X_product = np.hstack([X_binned, X * X_binned]) #组合训练数据集
print(X_product.shape)
#Output:
#(100, 20)plt.plot(X[:, 0], y, 'o')
reg = LinearRegression().fit(X_product, y)
line_product = np.hstack([line_binned, line * line_binned]) #组合测试数据集
plt.plot(line, reg.predict(line_product), label='linear regression combined')
for bin in bins:
plt.plot([bin, bin], [-3, 3], ':', c='k')
plt.legend(loc="best")from sklearn.preprocessing import PolynomialFeatures
# include polynomials up to x ** 10:
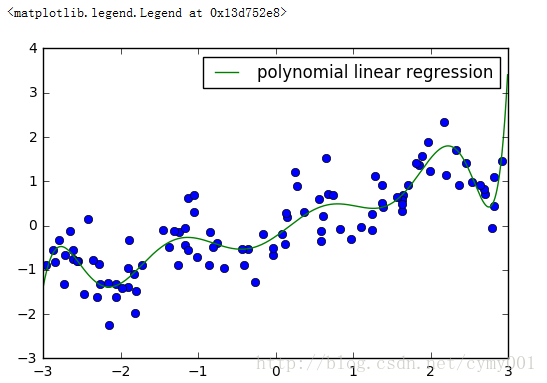
poly = PolynomialFeatures(degree=10)
poly.fit(X)
X_poly = poly.transform(X)
X_poly.shape
#Output:
#(100,11)
poly.get_feature_names()
#Output:
#['1',
# 'x0',
# 'x0^2',
# 'x0^3',
# 'x0^4',
# 'x0^5',
# 'x0^6',
# 'x0^7',
# 'x0^8',
# 'x0^9',
# 'x0^10']plt.plot(X[:, 0], y, 'o')
reg = LinearRegression().fit(X_poly, y)
line_poly = poly.transform(line) #对测试数据构造多项式特征(方法同上面的训练数据一样)
plt.plot(line, reg.predict(line_poly), label='polynomial linear regression')
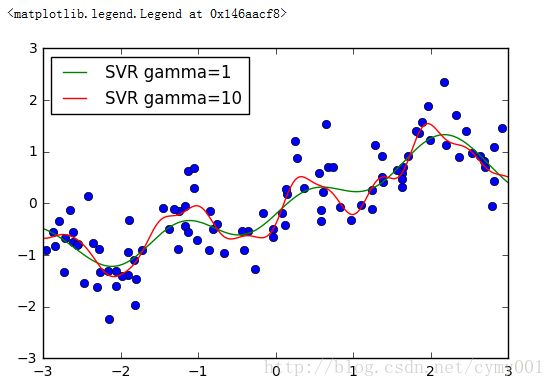
plt.legend(loc="best")from sklearn.svm import SVR
#http://scikit-learn.org/stable/modules/generated/sklearn.svm.SVR.html#sklearn.svm.SVR
plt.plot(X[:, 0], y, 'o')
for gamma in [1, 10]:
svr = SVR(gamma=gamma).fit(X, y) #SVR默认是rbf高斯核,gamma是核系数
plt.plot(line, svr.predict(line), label='SVR gamma=%d' % gamma)
plt.legend(loc="best")from sklearn.datasets import load_boston
from distutils.version import LooseVersion as Version
from sklearn import __version__ as sklearn_version
if Version(sklearn_version) < '0.18':
from sklearn.cross_validation import train_test_split
else:
from sklearn.model_selection import train_test_split
from sklearn.preprocessing import MinMaxScaler
boston = load_boston()
X_train, X_test, y_train, y_test = train_test_split(boston.data, boston.target, random_state=0)
# rescale data:
scaler = MinMaxScaler() #将特征列元素转化到指定上下界范围内,默认范围(0,1)
X_train_scaled = scaler.fit_transform(X_train)
X_test_scaled = scaler.transform(X_test)#一个小验证过程
poly=PolynomialFeatures(degree=2) #构造二次多项式特征对象
X_train_poly = poly.fit_transform(X_train_scaled)
X_test_poly = poly.fit_transform(X_test_scaled)
print(X_train.shape)
print(X_train_poly.shape)
#Output:
#(379, 13)
#(379, 105)poly = PolynomialFeatures(degree=2).fit(X_train_scaled)
X_train_poly = poly.transform(X_train_scaled)
X_test_poly = poly.transform(X_test_scaled)
print(X_train.shape)
print(X_train_poly.shape) #1+13+13*12/2+13
print(X_test.shape)
print(X_test_poly.shape)
#Output:
#(379, 13)
#(379, 105)
#(127, 13)
#(127, 105)print(poly.get_feature_names())
#Output:
#['1', 'x0', 'x1', 'x2', 'x3', 'x4', 'x5', 'x6', 'x7', 'x8', 'x9', 'x10', 'x11', 'x12', 'x0^2', 'x0 x1', 'x0 x2', 'x0 x3', 'x0 x4', 'x0 x5', 'x0 x6', 'x0 x7', 'x0 x8', 'x0 x9', 'x0 x10', 'x0 x11', 'x0 x12', 'x1^2', 'x1 x2', 'x1 x3', 'x1 x4', 'x1 x5', 'x1 x6', 'x1 x7', 'x1 x8', 'x1 x9', 'x1 x10', 'x1 x11', 'x1 x12', 'x2^2', 'x2 x3', 'x2 x4', 'x2 x5', 'x2 x6', 'x2 x7', 'x2 x8', 'x2 x9', 'x2 x10', 'x2 x11', 'x2 x12', 'x3^2', 'x3 x4', 'x3 x5', 'x3 x6', 'x3 x7', 'x3 x8', 'x3 x9', 'x3 x10', 'x3 x11', 'x3 x12', 'x4^2', 'x4 x5', 'x4 x6', 'x4 x7', 'x4 x8', 'x4 x9', 'x4 x10', 'x4 x11', 'x4 x12', 'x5^2', 'x5 x6', 'x5 x7', 'x5 x8', 'x5 x9', 'x5 x10', 'x5 x11', 'x5 x12', 'x6^2', 'x6 x7', 'x6 x8', 'x6 x9', 'x6 x10', 'x6 x11', 'x6 x12', 'x7^2', 'x7 x8', 'x7 x9', 'x7 x10', 'x7 x11', 'x7 x12', 'x8^2', 'x8 x9', 'x8 x10', 'x8 x11', 'x8 x12', 'x9^2', 'x9 x10', 'x9 x11', 'x9 x12', 'x10^2', 'x10 x11', 'x10 x12', 'x11^2', 'x11 x12', 'x12^2']from sklearn.linear_model import Ridge
#http://scikit-learn.org/stable/modules/generated/sklearn.linear_model.Ridge.html#sklearn.linear_model.Ridge
#This model solves a regression model where the loss function is the linear least squares function and regularization is given by the l2-norm.
ridge = Ridge().fit(X_train_scaled, y_train)
print("score without PolynomialFeatures: %f" % ridge.score(X_test_scaled, y_test))
ridge = Ridge().fit(X_train_poly, y_train)
print("score with PolynomialFeatures: %f" % ridge.score(X_test_poly, y_test))
#Output:
#score without PolynomialFeatures: 0.621370
#score with PolynomialFeatures: 0.753423from sklearn.ensemble import RandomForestRegressor
#http://scikit-learn.org/stable/modules/generated/sklearn.ensemble.RandomForestRegressor.html#sklearn.ensemble.RandomForestRegressor
rf = RandomForestRegressor(n_estimators=10,random_state=0).fit(X_train_scaled, y_train) #100棵树
print("score without PolynomialFeatures: %f" % rf.score(X_test_scaled, y_test))
rf = RandomForestRegressor(n_estimators=10,random_state=0).fit(X_train_poly, y_train)
print("score with PolynomialFeatures: %f" % rf.score(X_test_poly, y_test))
#Output:
#score without PolynomialFeatures: 0.757983
#score with PolynomialFeatures: 0.818360rf.apply(X_test_poly)
#apply方法返回数组的每一列是每棵树的叶子结点索引,40表示测试集第一个样本在随机森林里第一棵树木的第40个叶子结点上
#参数是X_test_poly是数组将被转换成一个稀疏csr_matrix
#Output:
#array([[ 40, 8, 17, ..., 104, 45, 127],
[ 75, 113, 202, ..., 8, 6, 128],
[182, 258, 256, ..., 379, 300, 242],
...,
[126, 209, 187, ..., 343, 241, 219],
[263, 325, 363, ..., 389, 333, 178],
[387, 71, 296, ..., 172, 139, 291]], dtype=int64)rf.apply(X_test_poly).shape
#Output:
#(127,10)