from scipy import *
import matplotlib.pyplot as plt
import numpy as np
from scipy.special import jn, yn, jn_zeros, yn_zeros
from scipy.integrate import quad, dblquad, tplquad
from numpy.fft import fftfreq
from scipy.fftpack import *
from scipy.linalg import *
from scipy import optimize
from scipy.interpolate import *
from scipy import stats
x = linspace(0, 10, 100)
fig, ax = plt.subplots()
for n in range(4):
ax.plot(x, jn(n, x), label=r"$J_%d(x)$" % n)
ax.legend()
val, abserr = quad(lambda x: exp(-x ** 2), -Inf, Inf)
print("numerical =", val, abserr)
def integrand(x, y):
return exp(-x**2-y**2)
x_lower = 0
x_upper = 10
y_lower = 0
y_upper = 10
val, abserr = dblquad(integrand, x_lower, x_upper, lambda x : y_lower, lambda x: y_upper)
print(val, abserr)
A = array([[1,2,8], [3,7,6], [2,5,3]])
b = array([1,2,3])
x = solve(A, b)
print(x)
evals, evecs = eig(A)
print(evals)
print(evecs)
print(inv(A))
x = linspace(-5, 3, 100)
def f(x):
return 4*x**3 + (x-2)**2 + x**4
x_min_local = optimize.fmin_bfgs(f, 2)
print(x_min_local)
x_max_global = optimize.fminbound(f, -10, 10)
print(x_max_global)
def f(x):
return sin(x)
n = arange(0, 10)
x = linspace(0, 9, 100)
y_meas = f(n) + 0.1 * randn(len(n))
y_real = f(x)
linear_interpolation = interp1d(n, y_meas)
y_interp1 = linear_interpolation(x)
cubic_interpolation = interp1d(n, y_meas, kind='cubic')
y_interp2 = cubic_interpolation(x)
fig, ax = plt.subplots(figsize=(10,4))
ax.plot(n, y_meas, 'bs', label='noisy data')
ax.plot(x, y_real, 'k', lw=2, label='true function')
ax.plot(x, y_interp1, 'r', label='linear interp')
ax.plot(x, y_interp2, 'g', label='cubic interp')
ax.legend(loc=3);
X = stats.poisson(3.5)
n = arange(0,15)
fig, axes = plt.subplots(3, 1, sharex=True)
axes[0].step(n, X.pmf(n))
axes[1].step(n, X.cdf(n))
axes[2].hist(X.rvs(size=1000));
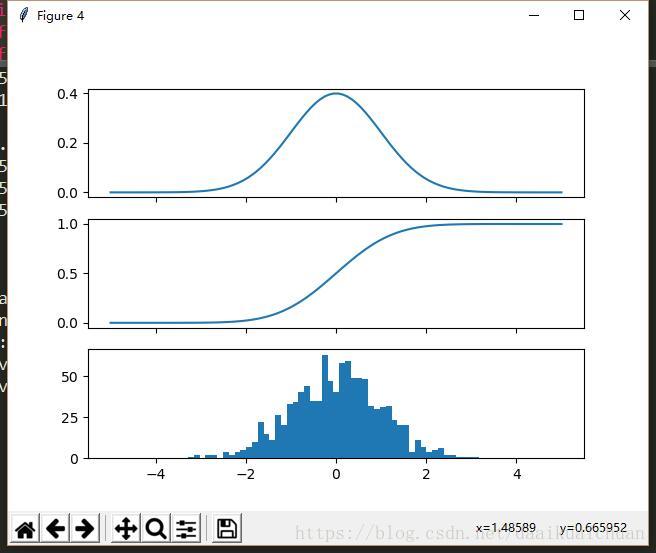
Y = stats.norm()
x = linspace(-5,5,100)
fig, axes = plt.subplots(3,1, sharex=True)
axes[0].plot(x, Y.pdf(x))
axes[1].plot(x, Y.cdf(x));
axes[2].hist(Y.rvs(size=1000), bins=50);
plt.show()
t_statistic, p_value = stats.ttest_ind(X.rvs(size=1000), X.rvs(size=1000))
print("t-statistic =", t_statistic)
print("p-value =", p_value)


