import pandas as pd
import numpy as np
from pandas import Series,DataFrame
obj = pd.Series([4,7,-5,3])
obj
0    4
1    7
2   -5
3    3
dtype: int64
obj.values
array([ 4, 7, -5, 3], dtype=int64)
obj.index
RangeIndex(start=0, stop=4, step=1)
obj2 = pd.Series([4,7,-5,3],index = ['d','b','a','c'])
obj2
d    4
b    7
a   -5
c    3
dtype: int64
obj2.index
Index(['d', 'b', 'a', 'c'], dtype='object')
obj2['a']
-5
obj2['d'] = 6
obj2[['c','a','d']]
c    3
a   -5
d    6
dtype: int64
obj2[obj2>0]
d    6
b    7
c    3
dtype: int64
obj2*2
d    12
b    14
a   -10
c     6
dtype: int64
np.exp(obj2)
d     403.428793
b    1096.633158
a       0.006738
c      20.085537
dtype: float64
'b'in obj2
True
'r' in obj2
False
sdata = {'Ohio': 35000, 'Texas': 71000, 'Oregon': 16000, 'Utah': 5000}
obj3 = pd.Series(sdata)
obj3
Ohio      35000
Texas     71000
Oregon    16000
Utah       5000
dtype: int64
states = ['California', 'Ohio', 'Oregon', 'Texas']
obj4 = pd.Series(sdata,index=states)
obj4
California        NaN
Ohio          35000.0
Oregon        16000.0
Texas         71000.0
dtype: float64
pd.isnull(obj4)
California     True
Ohio          False
Oregon        False
Texas         False
dtype: bool
pd.notnull(obj4)
California    False
Ohio           True
Oregon         True
Texas          True
dtype: bool
obj4.isnull()
California     True
Ohio          False
Oregon        False
Texas         False
dtype: bool
obj3
Ohio      35000
Texas     71000
Oregon    16000
Utah       5000
dtype: int64
obj4
California        NaN
Ohio          35000.0
Oregon        16000.0
Texas         71000.0
dtype: float64
obj3 + obj4
California         NaN
Ohio           70000.0
Oregon         32000.0
Texas         142000.0
Utah               NaN
dtype: float64
obj4.name = 'population'
obj4.index.name = 'state'
obj4
state
California        NaN
Ohio          35000.0
Oregon        16000.0
Texas         71000.0
Name: population, dtype: float64
obj
0    4
1    7
2   -5
3    3
dtype: int64
obj.index = ['Bob', 'Steve', 'Jeff', 'Ryan']
obj
Bob      4
Steve    7
Jeff    -5
Ryan     3
dtype: int64
data = data = {'state': ['Ohio', 'Ohio', 'Ohio', 'Nevada', 'Nevada', 'Nevada'],
        'year': [2000, 2001, 2002, 2001, 2002, 2003],
        'pop': [1.5, 1.7, 3.6, 2.4, 2.9, 3.2]}
frame = pd.DataFrame(data)
frame
|
state |
year |
pop |
| 0 |
Ohio |
2000 |
1.5 |
| 1 |
Ohio |
2001 |
1.7 |
| 2 |
Ohio |
2002 |
3.6 |
| 3 |
Nevada |
2001 |
2.4 |
| 4 |
Nevada |
2002 |
2.9 |
| 5 |
Nevada |
2003 |
3.2 |
frame.head()
|
state |
year |
pop |
| 0 |
Ohio |
2000 |
1.5 |
| 1 |
Ohio |
2001 |
1.7 |
| 2 |
Ohio |
2002 |
3.6 |
| 3 |
Nevada |
2001 |
2.4 |
| 4 |
Nevada |
2002 |
2.9 |
pd.DataFrame(data,columns=['year','state','pop'])
|
year |
state |
pop |
| 0 |
2000 |
Ohio |
1.5 |
| 1 |
2001 |
Ohio |
1.7 |
| 2 |
2002 |
Ohio |
3.6 |
| 3 |
2001 |
Nevada |
2.4 |
| 4 |
2002 |
Nevada |
2.9 |
| 5 |
2003 |
Nevada |
3.2 |
frame2 = pd.DataFrame(data, columns=['year', 'state', 'pop', 'debt'],
                      index=['one', 'two', 'three', 'four', 'five', 'six'])
frame2
|
year |
state |
pop |
debt |
| one |
2000 |
Ohio |
1.5 |
NaN |
| two |
2001 |
Ohio |
1.7 |
NaN |
| three |
2002 |
Ohio |
3.6 |
NaN |
| four |
2001 |
Nevada |
2.4 |
NaN |
| five |
2002 |
Nevada |
2.9 |
NaN |
| six |
2003 |
Nevada |
3.2 |
NaN |
frame2.columns
Index(['year', 'state', 'pop', 'debt'], dtype='object')
frame2['state']
one        Ohio
two        Ohio
three      Ohio
four     Nevada
five     Nevada
six      Nevada
Name: state, dtype: object
frame2.year
one      2000
two      2001
three    2002
four     2001
five     2002
six      2003
Name: year, dtype: int64
frame2.loc['three']
year     2002
state    Ohio
pop       3.6
debt      NaN
Name: three, dtype: object
frame2['debt'] = 16.5
frame2
|
year |
state |
pop |
debt |
| one |
2000 |
Ohio |
1.5 |
16.5 |
| two |
2001 |
Ohio |
1.7 |
16.5 |
| three |
2002 |
Ohio |
3.6 |
16.5 |
| four |
2001 |
Nevada |
2.4 |
16.5 |
| five |
2002 |
Nevada |
2.9 |
16.5 |
| six |
2003 |
Nevada |
3.2 |
16.5 |
frame2['debt'] = np.arange(6.)
frame2
|
year |
state |
pop |
debt |
| one |
2000 |
Ohio |
1.5 |
0.0 |
| two |
2001 |
Ohio |
1.7 |
1.0 |
| three |
2002 |
Ohio |
3.6 |
2.0 |
| four |
2001 |
Nevada |
2.4 |
3.0 |
| five |
2002 |
Nevada |
2.9 |
4.0 |
| six |
2003 |
Nevada |
3.2 |
5.0 |
val = pd.Series([-1.2,-1.5,-1.7],index = ['two','four','five'])
frame2['debt'] = val
frame2
|
year |
state |
pop |
debt |
| one |
2000 |
Ohio |
1.5 |
NaN |
| two |
2001 |
Ohio |
1.7 |
-1.2 |
| three |
2002 |
Ohio |
3.6 |
NaN |
| four |
2001 |
Nevada |
2.4 |
-1.5 |
| five |
2002 |
Nevada |
2.9 |
-1.7 |
| six |
2003 |
Nevada |
3.2 |
NaN |
frame2['eastern'] = frame2.state == 'Ohio'
frame2
|
year |
state |
pop |
debt |
eastern |
| one |
2000 |
Ohio |
1.5 |
NaN |
True |
| two |
2001 |
Ohio |
1.7 |
-1.2 |
True |
| three |
2002 |
Ohio |
3.6 |
NaN |
True |
| four |
2001 |
Nevada |
2.4 |
-1.5 |
False |
| five |
2002 |
Nevada |
2.9 |
-1.7 |
False |
| six |
2003 |
Nevada |
3.2 |
NaN |
False |
del frame2['eastern']
frame2
|
year |
state |
pop |
debt |
| one |
2000 |
Ohio |
1.5 |
NaN |
| two |
2001 |
Ohio |
1.7 |
-1.2 |
| three |
2002 |
Ohio |
3.6 |
NaN |
| four |
2001 |
Nevada |
2.4 |
-1.5 |
| five |
2002 |
Nevada |
2.9 |
-1.7 |
| six |
2003 |
Nevada |
3.2 |
NaN |
pop = {'Nevada': {2001: 2.4, 2002: 2.9},
'Ohio': {2000: 1.5, 2001: 1.7, 2002: 3.6}}
frame3 = pd.DataFrame(pop)
frame3
|
Nevada |
Ohio |
| 2000 |
NaN |
1.5 |
| 2001 |
2.4 |
1.7 |
| 2002 |
2.9 |
3.6 |
frame3.T
|
2000 |
2001 |
2002 |
| Nevada |
NaN |
2.4 |
2.9 |
| Ohio |
1.5 |
1.7 |
3.6 |
frame3.index.name = 'year';frame3.columns.name = 'state'
frame3
| state |
Nevada |
Ohio |
| year |
|
|
| 2000 |
NaN |
1.5 |
| 2001 |
2.4 |
1.7 |
| 2002 |
2.9 |
3.6 |
frame3.values
array([[nan, 1.5],
       [2.4, 1.7],
       [2.9, 3.6]])
frame2.values
array([[2000, 'Ohio', 1.5, nan],
       [2001, 'Ohio', 1.7, -1.2],
       [2002, 'Ohio', 3.6, nan],
       [2001, 'Nevada', 2.4, -1.5],
       [2002, 'Nevada', 2.9, -1.7],
       [2003, 'Nevada', 3.2, nan]], dtype=object)
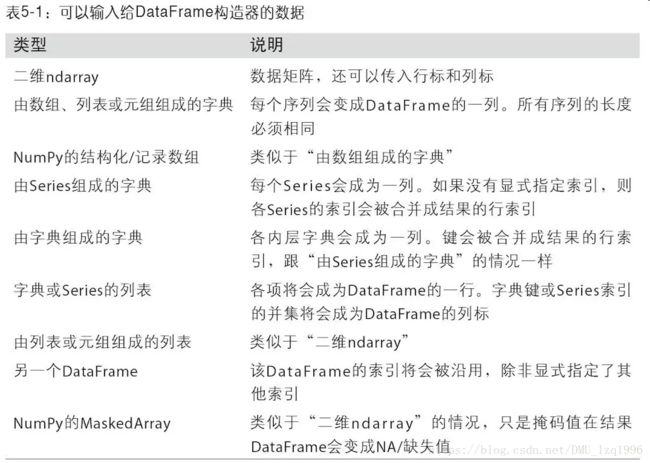
obj = pd.Series(range(3),index=['a','b','c'])
index = obj.index
index
Index(['a', 'b', 'c'], dtype='object')
index[1:]
Index(['b', 'c'], dtype='object')
labels = pd.Index(np.arange(3))
labels
Int64Index([0, 1, 2], dtype='int64')
obj2 = pd.Series([1.5,-2.5,0],index=labels)
obj2
0    1.5
1   -2.5
2    0.0
dtype: float64
obj2.index is labels
True
frame3
|
Nevada |
Ohio |
| 2000 |
NaN |
1.5 |
| 2001 |
2.4 |
1.7 |
| 2002 |
2.9 |
3.6 |
frame3.columns
Index(['Nevada', 'Ohio'], dtype='object')
'Ohio'in frame3.columns
True
dup_labels = pd.Index(['foo','foo', 'bar', 'bar'])
dup_labels
Index(['foo', 'foo', 'bar', 'bar'], dtype='object')
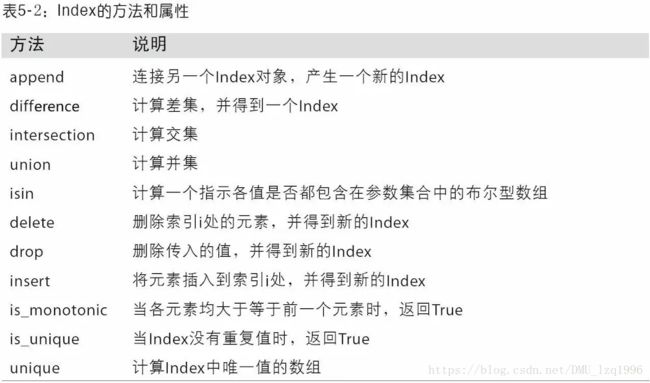
obj = pd.Series([4.5, 7.2, -5.3, 3.6], index=['d', 'b', 'a', 'c'])
obj
d    4.5
b    7.2
a   -5.3
c    3.6
dtype: float64
obj2 = obj.reindex(['a', 'b', 'c', 'd', 'e'])
obj2
a   -5.3
b    7.2
c    3.6
d    4.5
e    NaN
dtype: float64
obj3 = pd.Series(['blue','purple','yellow'],index=[0,2,4])
obj3
0      blue
2    purple
4    yellow
dtype: object
obj3.reindex(range(6),method='ffill')
0      blue
1      blue
2    purple
3    purple
4    yellow
5    yellow
dtype: object
frame = pd.DataFrame(np.arange(9).reshape((3, 3)),
                         index=['a', 'c', 'd'],
                         columns=['Ohio', 'Texas', 'California'])
frame
|
Ohio |
Texas |
California |
| a |
0 |
1 |
2 |
| c |
3 |
4 |
5 |
| d |
6 |
7 |
8 |
frame2 = frame.reindex(['a','b','c','d'])
frame2
|
Ohio |
Texas |
California |
| a |
0.0 |
1.0 |
2.0 |
| b |
NaN |
NaN |
NaN |
| c |
3.0 |
4.0 |
5.0 |
| d |
6.0 |
7.0 |
8.0 |
states = ['Texas','Utah','California']
frame.reindex(columns=states)
|
Texas |
Utah |
California |
| a |
1 |
NaN |
2 |
| c |
4 |
NaN |
5 |
| d |
7 |
NaN |
8 |

obj = pd.Series(np.arange(5.), index=['a', 'b', 'c', 'd', 'e'])
obj
a    0.0
b    1.0
c    2.0
d    3.0
e    4.0
dtype: float64
new_obj = obj.drop('c')
new_obj
a    0.0
b    1.0
d    3.0
e    4.0
dtype: float64
obj.drop(['d','c'])
a    0.0
b    1.0
e    4.0
dtype: float64
data = pd.DataFrame(np.arange(16).reshape((4, 4)),
                        index=['Ohio', 'Colorado', 'Utah', 'New York'],
                        columns=['one', 'two', 'three', 'four'])

data
|
one |
two |
three |
four |
| Ohio |
0 |
1 |
2 |
3 |
| Colorado |
4 |
5 |
6 |
7 |
| Utah |
8 |
9 |
10 |
11 |
| New York |
12 |
13 |
14 |
15 |
data.drop(['Colorado','Ohio'])
|
one |
two |
three |
four |
| Utah |
8 |
9 |
10 |
11 |
| New York |
12 |
13 |
14 |
15 |
data.drop('two',axis=1)
|
one |
three |
four |
| Ohio |
0 |
2 |
3 |
| Colorado |
4 |
6 |
7 |
| Utah |
8 |
10 |
11 |
| New York |
12 |
14 |
15 |
data.drop(['two','four'],axis = 'columns')
|
one |
three |
| Ohio |
0 |
2 |
| Colorado |
4 |
6 |
| Utah |
8 |
10 |
| New York |
12 |
14 |
obj
a    0.0
b    1.0
c    2.0
d    3.0
e    4.0
dtype: float64
obj.drop('c',inplace=True)
obj
a    0.0
b    1.0
d    3.0
e    4.0
dtype: float64
obj
a    0.0
b    1.0
d    3.0
e    4.0
dtype: float64
obj = pd.Series(np.arange(4),index=['a', 'b', 'c', 'd'])
obj
a    0
b    1
c    2
d    3
dtype: int32
obj['b']
1
obj[1]
1
obj[2:4]
c    2
d    3
dtype: int32
obj[['b','a','d']]
b    1
a    0
d    3
dtype: int32
obj[[1,3]]
b    1
d    3
dtype: int32
obj[obj<2]
a    0
b    1
dtype: int32
obj['b':'c']
b    1
c    2
dtype: int32
obj['b':'c'] = 5
obj
a    0
b    5
c    5
d    3
dtype: int32
data = pd.DataFrame(np.arange(16).reshape((4, 4)),
                      index=['Ohio', 'Colorado', 'Utah', 'New York'],
                      columns=['one', 'two', 'three', 'four'])

data
|
one |
two |
three |
four |
| Ohio |
0 |
1 |
2 |
3 |
| Colorado |
4 |
5 |
6 |
7 |
| Utah |
8 |
9 |
10 |
11 |
| New York |
12 |
13 |
14 |
15 |
data['two']
Ohio         1
Colorado     5
Utah         9
New York    13
Name: two, dtype: int32
data[['three','one']]
|
three |
one |
| Ohio |
2 |
0 |
| Colorado |
6 |
4 |
| Utah |
10 |
8 |
| New York |
14 |
12 |
data[:2]
|
one |
two |
three |
four |
| Ohio |
0 |
1 |
2 |
3 |
| Colorado |
4 |
5 |
6 |
7 |
data[data['three']>5]
|
one |
two |
three |
four |
| Colorado |
4 |
5 |
6 |
7 |
| Utah |
8 |
9 |
10 |
11 |
| New York |
12 |
13 |
14 |
15 |
data<5
|
one |
two |
three |
four |
| Ohio |
True |
True |
True |
True |
| Colorado |
True |
False |
False |
False |
| Utah |
False |
False |
False |
False |
| New York |
False |
False |
False |
False |
data[data<5] = 0
data
|
one |
two |
three |
four |
| Ohio |
0 |
0 |
0 |
0 |
| Colorado |
0 |
5 |
6 |
7 |
| Utah |
8 |
9 |
10 |
11 |
| New York |
12 |
13 |
14 |
15 |
data.loc['Colorado',['two','three']]
two      5
three    6
Name: Colorado, dtype: int32
data.iloc[2,[3,0,1]]
four    11
one      8
two      9
Name: Utah, dtype: int32
data.iloc[2]
one       8
two       9
three    10
four     11
Name: Utah, dtype: int32
data.iloc[[1,2],[3,0,1]]
|
four |
one |
two |
| Colorado |
7 |
0 |
5 |
| Utah |
11 |
8 |
9 |
data.loc[:'Utah','two']
Ohio        0
Colorado    5
Utah        9
Name: two, dtype: int32
data.iloc[:,:3][data.three>5]
|
one |
two |
three |
| Colorado |
0 |
5 |
6 |
| Utah |
8 |
9 |
10 |
| New York |
12 |
13 |
14 |
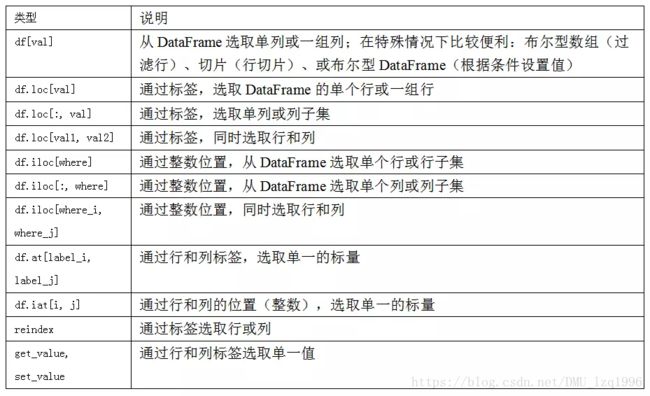
ser = pd.Series(np.arange(3))
ser
0    0
1    1
2    2
dtype: int32
ser[-1]
---------------------------------------------------------------------------

KeyError                                  Traceback (most recent call last)

 in ()
----> 1 ser[-1]


C:\Anaconda\lib\site-packages\pandas\core\series.py in __getitem__(self, key)
    765         key = com._apply_if_callable(key, self)
    766         try:
--> 767             result = self.index.get_value(self, key)
    768
    769             if not is_scalar(result):


C:\Anaconda\lib\site-packages\pandas\core\indexes\base.py in get_value(self, series, key)
   3116         try:
   3117             return self._engine.get_value(s, k,
-> 3118                                           tz=getattr(series.dtype, 'tz', None))
   3119         except KeyError as e1:
   3120             if len(self) > 0 and self.inferred_type in ['integer', 'boolean']:


pandas\_libs\index.pyx in pandas._libs.index.IndexEngine.get_value()


pandas\_libs\index.pyx in pandas._libs.index.IndexEngine.get_value()


pandas\_libs\index.pyx in pandas._libs.index.IndexEngine.get_loc()


pandas\_libs\hashtable_class_helper.pxi in pandas._libs.hashtable.Int64HashTable.get_item()


pandas\_libs\hashtable_class_helper.pxi in pandas._libs.hashtable.Int64HashTable.get_item()


KeyError: -1
ser2 = pd.Series(np.arange(3.), index=['a', 'b', 'c'])
ser2[-1]
2.0
ser[:1]
0    0
dtype: int32
ser.loc[:1]
0    0
1    1
dtype: int32
s1 = pd.Series([7.3, -2.5, 3.4, 1.5], index=['a', 'c', 'd', 'e'])
s2 = pd.Series([-2.1, 3.6, -1.5, 4, 3.1],
index=['a', 'c', 'e', 'f', 'g'])
s1
a    7.3
c   -2.5
d    3.4
e    1.5
dtype: float64
s2
a   -2.1
c    3.6
e   -1.5
f    4.0
g    3.1
dtype: float64
s1 + s2
a    5.2
c    1.1
d    NaN
e    0.0
f    NaN
g    NaN
dtype: float64
df1 = pd.DataFrame(np.arange(9.).reshape((3, 3)), columns=list('bcd'),
                    index=['Ohio', 'Texas', 'Colorado'])
df2 = pd.DataFrame(np.arange(12.).reshape((4, 3)), columns=list('bde'),
                       index=['Utah', 'Ohio', 'Texas', 'Oregon'])
df1
|
b |
c |
d |
| Ohio |
0.0 |
1.0 |
2.0 |
| Texas |
3.0 |
4.0 |
5.0 |
| Colorado |
6.0 |
7.0 |
8.0 |
df2
|
b |
d |
e |
| Utah |
0.0 |
1.0 |
2.0 |
| Ohio |
3.0 |
4.0 |
5.0 |
| Texas |
6.0 |
7.0 |
8.0 |
| Oregon |
9.0 |
10.0 |
11.0 |
df1 + df2
|
b |
c |
d |
e |
| Colorado |
NaN |
NaN |
NaN |
NaN |
| Ohio |
3.0 |
NaN |
6.0 |
NaN |
| Oregon |
NaN |
NaN |
NaN |
NaN |
| Texas |
9.0 |
NaN |
12.0 |
NaN |
| Utah |
NaN |
NaN |
NaN |
NaN |
df1 = pd.DataFrame(np.arange(12.).reshape((3, 4)),
columns=list('abcd'))
df2 = pd.DataFrame(np.arange(20.).reshape((4, 5)),
columns=list('abcde'))
df2.loc[1,'b'] = np.nan
df1
|
a |
b |
c |
d |
| 0 |
0.0 |
1.0 |
2.0 |
3.0 |
| 1 |
4.0 |
5.0 |
6.0 |
7.0 |
| 2 |
8.0 |
9.0 |
10.0 |
11.0 |
df2
|
a |
b |
c |
d |
e |
| 0 |
0.0 |
1.0 |
2.0 |
3.0 |
4.0 |
| 1 |
5.0 |
NaN |
7.0 |
8.0 |
9.0 |
| 2 |
10.0 |
11.0 |
12.0 |
13.0 |
14.0 |
| 3 |
15.0 |
16.0 |
17.0 |
18.0 |
19.0 |
df1 + df2
|
a |
b |
c |
d |
e |
| 0 |
0.0 |
2.0 |
4.0 |
6.0 |
NaN |
| 1 |
9.0 |
NaN |
13.0 |
15.0 |
NaN |
| 2 |
18.0 |
20.0 |
22.0 |
24.0 |
NaN |
| 3 |
NaN |
NaN |
NaN |
NaN |
NaN |
df1.add(df2,fill_value=0)
|
a |
b |
c |
d |
e |
| 0 |
0.0 |
2.0 |
4.0 |
6.0 |
4.0 |
| 1 |
9.0 |
5.0 |
13.0 |
15.0 |
9.0 |
| 2 |
18.0 |
20.0 |
22.0 |
24.0 |
14.0 |
| 3 |
15.0 |
16.0 |
17.0 |
18.0 |
19.0 |
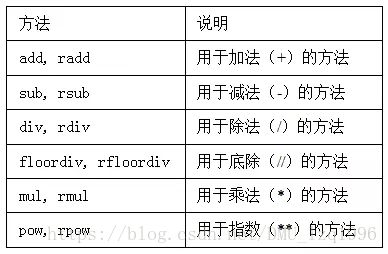
arr = np.arange(12).reshape(3,4)
arr
array([[ 0,  1,  2,  3],
       [ 4,  5,  6,  7],
       [ 8,  9, 10, 11]])
arr[0]
array([0, 1, 2, 3])
arr - arr[0]
array([[0, 0, 0, 0],
       [4, 4, 4, 4],
       [8, 8, 8, 8]])
frame = pd.DataFrame(np.arange(12.).reshape((4, 3)),
                      columns=list('bde'),
                      index=['Utah', 'Ohio', 'Texas', 'Oregon'])
series =frame.iloc[0]
frame
|
b |
d |
e |
| Utah |
0.0 |
1.0 |
2.0 |
| Ohio |
3.0 |
4.0 |
5.0 |
| Texas |
6.0 |
7.0 |
8.0 |
| Oregon |
9.0 |
10.0 |
11.0 |
series
b    0.0
d    1.0
e    2.0
Name: Utah, dtype: float64
frame - series
|
b |
d |
e |
| Utah |
0.0 |
0.0 |
0.0 |
| Ohio |
3.0 |
3.0 |
3.0 |
| Texas |
6.0 |
6.0 |
6.0 |
| Oregon |
9.0 |
9.0 |
9.0 |
series2 = pd.Series(range(3), index=['b', 'e', 'f'])
frame + series2
|
b |
d |
e |
f |
| Utah |
0.0 |
NaN |
3.0 |
NaN |
| Ohio |
3.0 |
NaN |
6.0 |
NaN |
| Texas |
6.0 |
NaN |
9.0 |
NaN |
| Oregon |
9.0 |
NaN |
12.0 |
NaN |
series3 = frame['d']
frame
|
b |
d |
e |
| Utah |
0.0 |
1.0 |
2.0 |
| Ohio |
3.0 |
4.0 |
5.0 |
| Texas |
6.0 |
7.0 |
8.0 |
| Oregon |
9.0 |
10.0 |
11.0 |
series3
Utah       1.0
Ohio       4.0
Texas      7.0
Oregon    10.0
Name: d, dtype: float64
frame.sub(series3,axis='index')
|
b |
d |
e |
| Utah |
-1.0 |
0.0 |
1.0 |
| Ohio |
-1.0 |
0.0 |
1.0 |
| Texas |
-1.0 |
0.0 |
1.0 |
| Oregon |
-1.0 |
0.0 |
1.0 |
frame = pd.DataFrame(np.random.randn(4, 3), columns=list('bde'),
                      index=['Utah', 'Ohio', 'Texas', 'Oregon'])
frame
|
b |
d |
e |
| Utah |
-0.951265 |
-0.498273 |
-0.388690 |
| Ohio |
1.988546 |
0.370789 |
-0.488038 |
| Texas |
0.692938 |
-0.160944 |
0.654771 |
| Oregon |
-1.314237 |
1.163286 |
-1.687210 |
np.abs(frame)
|
b |
d |
e |
| Utah |
0.951265 |
0.498273 |
0.388690 |
| Ohio |
1.988546 |
0.370789 |
0.488038 |
| Texas |
0.692938 |
0.160944 |
0.654771 |
| Oregon |
1.314237 |
1.163286 |
1.687210 |
f = lambda x:x.max()-x.min()
frame.apply(f)
b    3.302783
d    1.661559
e    2.341980
dtype: float64
frame.apply(f,axis='columns')
Utah      0.562574
Ohio      2.476585
Texas     0.853882
Oregon    2.850495
dtype: float64
def f(x):
return pd.Series([x.min(), x.max()], index=['min', 'max'])
frame.apply(f)
|
b |
d |
e |
| min |
-1.314237 |
-0.498273 |
-1.687210 |
| max |
1.988546 |
1.163286 |
0.654771 |
format = lambda x: '%.2f' % x
frame.applymap(format)
|
b |
d |
e |
| Utah |
-0.95 |
-0.50 |
-0.39 |
| Ohio |
1.99 |
0.37 |
-0.49 |
| Texas |
0.69 |
-0.16 |
0.65 |
| Oregon |
-1.31 |
1.16 |
-1.69 |
frame['e'].map(format)
Utah      -0.39
Ohio      -0.49
Texas      0.65
Oregon    -1.69
Name: e, dtype: object
obj = pd.Series(range(4), index=['d', 'a', 'b', 'c'])
obj.sort_index()
a    1
b    2
c    3
d    0
dtype: int64
frame = pd.DataFrame(np.arange(8).reshape((2, 4)),
                       index=['three', 'one'],
                       columns=['d', 'a', 'b', 'c'])
frame.sort_index()
|
d |
a |
b |
c |
| one |
4 |
5 |
6 |
7 |
| three |
0 |
1 |
2 |
3 |
frame.sort_index(axis=1,ascending=False)
|
d |
c |
b |
a |
| three |
0 |
3 |
2 |
1 |
| one |
4 |
7 |
6 |
5 |
obj = pd.Series([4,7,-3,2])
obj.sort_values()
2   -3
3    2
0    4
1    7
dtype: int64
obj = pd.Series([4, np.nan, 7, np.nan, -3, 2])
obj.sort_values()
4   -3.0
5    2.0
0    4.0
2    7.0
1    NaN
3    NaN
dtype: float64
frame = pd.DataFrame({'b': [4, 7, -3, 2], 'a': [0, 1, 0, 1]})
frame
|
b |
a |
| 0 |
4 |
0 |
| 1 |
7 |
1 |
| 2 |
-3 |
0 |
| 3 |
2 |
1 |
frame.sort_values(by='b')
|
b |
a |
| 2 |
-3 |
0 |
| 3 |
2 |
1 |
| 0 |
4 |
0 |
| 1 |
7 |
1 |
frame.sort_values(by=['a','b'])
|
b |
a |
| 2 |
-3 |
0 |
| 0 |
4 |
0 |
| 3 |
2 |
1 |
| 1 |
7 |
1 |
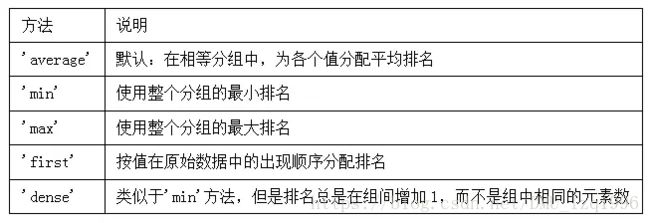
obj=pd.Series([7, -5, 7, 4, 2, 0, 4])
obj.rank()
0    6.5
1    1.0
2    6.5
3    4.5
4    3.0
5    2.0
6    4.5
dtype: float64
obj.rank(method='first')
0    6.0
1    1.0
2    7.0
3    4.0
4    3.0
5    2.0
6    5.0
dtype: float64
obj.rank(ascending=False, method='max')
0    2.0
1    7.0
2    2.0
3    4.0
4    5.0
5    6.0
6    4.0
dtype: float64
frame = pd.DataFrame({'b': [4.3, 7, -3, 2], 'a': [0, 1, 0, 1],
                      'c': [-2, 5, 8, -2.5]})
frame
|
b |
a |
c |
| 0 |
4.3 |
0 |
-2.0 |
| 1 |
7.0 |
1 |
5.0 |
| 2 |
-3.0 |
0 |
8.0 |
| 3 |
2.0 |
1 |
-2.5 |
frame.rank(axis='columns')
|
b |
a |
c |
| 0 |
3.0 |
2.0 |
1.0 |
| 1 |
3.0 |
1.0 |
2.0 |
| 2 |
1.0 |
2.0 |
3.0 |
| 3 |
3.0 |
2.0 |
1.0 |
obj = pd.Series(range(5),index=['a','a','b','b','c'])
obj
a    0
a    1
b    2
b    3
c    4
dtype: int64
obj.index.is_unique
False
obj['a']
a    0
a    1
dtype: int64
obj['b']
b    2
b    3
dtype: int64
df = pd.DataFrame(np.random.randn(4,3),index= ['a','a','b','b'])
df
|
0 |
1 |
2 |
| a |
1.265240 |
0.407293 |
-0.652129 |
| a |
0.268019 |
-1.423912 |
1.297783 |
| b |
0.797760 |
-0.353663 |
1.323543 |
| b |
0.961888 |
0.227132 |
1.843558 |
df.loc['b']
|
0 |
1 |
2 |
| b |
0.797760 |
-0.353663 |
1.323543 |
| b |
0.961888 |
0.227132 |
1.843558 |
df = pd.DataFrame([[1.4, np.nan], [7.1, -4.5],
[np.nan, np.nan], [0.75, -1.3]],
index=['a', 'b', 'c', 'd'],
columns=['one', 'two'])
df
|
one |
two |
| a |
1.40 |
NaN |
| b |
7.10 |
-4.5 |
| c |
NaN |
NaN |
| d |
0.75 |
-1.3 |
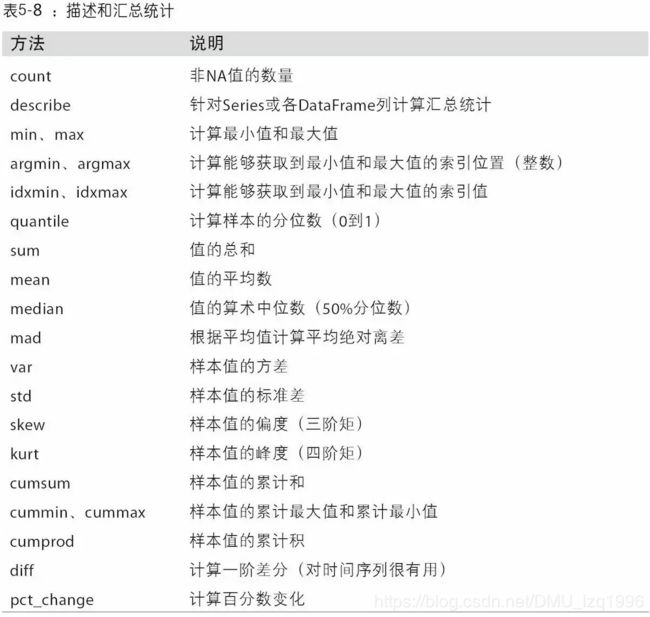
df.sum()
one    9.25
two   -5.80
dtype: float64
df.sum(axis=1)
a    1.40
b    2.60
c    0.00
d   -0.55
dtype: float64
df.mean(axis='columns',skipna=False)
a      NaN
b    1.300
c      NaN
d   -0.275
dtype: float64
df.idxmax()
one    b
two    d
dtype: object
df.cumsum()
|
one |
two |
| a |
1.40 |
NaN |
| b |
8.50 |
-4.5 |
| c |
NaN |
NaN |
| d |
9.25 |
-5.8 |
df.describe()
|
one |
two |
| count |
3.000000 |
2.000000 |
| mean |
3.083333 |
-2.900000 |
| std |
3.493685 |
2.262742 |
| min |
0.750000 |
-4.500000 |
| 25% |
1.075000 |
-3.700000 |
| 50% |
1.400000 |
-2.900000 |
| 75% |
4.250000 |
-2.100000 |
| max |
7.100000 |
-1.300000 |
obj = pd.Series(['a', 'a', 'b', 'c'] * 4)
obj.describe()
count     16
unique     3
top        a
freq       8
dtype: object

import pandas_datareader.data as web
all_data = {ticker:web.get_data_yahoo(ticker)
for ticker in ['AAPL', 'IBM', 'MSFT', 'GOOG']}
price = pd.DataFrame({ticker: data['Adj Close']
for ticker, data in all_data.items()})
volume = pd.DataFrame({ticker: data['Volume']
for ticker, data in all_data.items()})
returns = price.pct_change()
returns.tail()
|
AAPL |
IBM |
MSFT |
GOOG |
| Date |
|
|
|
|
| 2018-10-18 |
-0.023374 |
-0.026110 |
-0.019962 |
-0.024846 |
| 2018-10-19 |
0.015230 |
-0.011107 |
0.001475 |
0.007804 |
| 2018-10-22 |
0.006110 |
0.007126 |
0.008927 |
0.004287 |
| 2018-10-23 |
0.009427 |
0.009152 |
-0.013956 |
0.002297 |
| 2018-10-24 |
-0.034302 |
-0.030486 |
-0.053469 |
-0.048003 |
returns['MSFT'].corr(returns['IBM'])
0.4746674318628231
returns["MSFT"].cov(returns["IBM"])
8.150193655338736e-05
returns.MSFT.corr(returns.IBM)
0.4746674318628231
returns.corr()
|
AAPL |
IBM |
MSFT |
GOOG |
| AAPL |
1.000000 |
0.364434 |
0.421984 |
0.438015 |
| IBM |
0.364434 |
1.000000 |
0.474667 |
0.398449 |
| MSFT |
0.421984 |
0.474667 |
1.000000 |
0.516364 |
| GOOG |
0.438015 |
0.398449 |
0.516364 |
1.000000 |
returns.cov()
|
AAPL |
IBM |
MSFT |
GOOG |
| AAPL |
0.000252 |
0.000070 |
0.000095 |
0.000106 |
| IBM |
0.000070 |
0.000146 |
0.000082 |
0.000073 |
| MSFT |
0.000095 |
0.000082 |
0.000202 |
0.000112 |
| GOOG |
0.000106 |
0.000073 |
0.000112 |
0.000232 |
returns.corrwith(returns.IBM)
AAPL    0.364434
IBM     1.000000
MSFT    0.474667
GOOG    0.398449
dtype: float64
returns.corrwith(volume)
AAPL   -0.065065
IBM    -0.173822
MSFT   -0.088563
GOOG   -0.016396
dtype: float64
obj = pd.Series(['c', 'a', 'd', 'a', 'a', 'b', 'b', 'c', 'c'])
uniques = obj.unique()
uniques
array(['c', 'a', 'd', 'b'], dtype=object)
obj.value_counts()
c    3
a    3
b    2
d    1
dtype: int64
obj
0    c
1    a
2    d
3    a
4    a
5    b
6    b
7    c
8    c
dtype: object
mask = obj.isin(['b','c'])
mask
0     True
1    False
2    False
3    False
4    False
5     True
6     True
7     True
8     True
dtype: bool
obj[mask]
0    c
5    b
6    b
7    c
8    c
dtype: object
to_match = pd.Series(['c', 'a', 'b', 'b', 'c', 'a'])
unique_values = pd.Series(['c','b','a'])
pd.Index(unique_values).get_indexer(to_match)
array([0, 2, 1, 1, 0, 2], dtype=int64)


