import matplotlib.pyplot as plt
import numpy as np
data = np.arange(10)
data
array([0, 1, 2, 3, 4, 5, 6, 7, 8, 9])
plt.plot(data)
[]
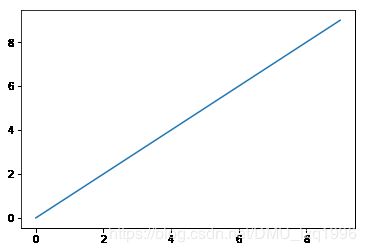
fig = plt.figure()
ax1 = fig.add_subplot(221)
ax2 = fig.add_subplot(222)
ax3 = fig.add_subplot(223)

plt.plot(np.random.randn(50).cumsum(),'k--')
[]
ax1.hist(np.random.randn(100), bins=20, color='k', alpha=0.3)
(array([ 1.,  3.,  2.,  3.,  2.,  8.,  1.,  4., 11., 11.,  7., 13., 10.,
         3.,  6.,  2.,  7.,  3.,  1.,  2.]),
 array([-2.62147564, -2.3737514 , -2.12602716, -1.87830293, -1.63057869,
        -1.38285445, -1.13513022, -0.88740598, -0.63968174, -0.39195751,
        -0.14423327,  0.10349097,  0.3512152 ,  0.59893944,  0.84666368,
         1.09438791,  1.34211215,  1.58983639,  1.83756062,  2.08528486,
         2.3330091 ]),
 )
ax2.scatter(np.arange(30), np.arange(30) + 3 * np.random.randn(30))
fig,axes = plt.subplots(3,3)
axes

array([[,
        ,
        ],
       [,
        ,
        ],
       [,
        ,
        ]],
      dtype=object)
fig,axex = plt.subplots(2,2,sharex=True,sharey=True)
for i in range(2):
for j in range(2):
axex[i,j].hist(np.random.randn(500),bins=50,color='k',alpha=0.5)
plt.subplots_adjust(wspace=0,hspace=0)

plt.plot(np.random.randn(30).cumsum(),'k--')

[]
plt.plot(np.random.randn(30).cumsum(), color='r', linestyle='dashed', marker='o')

[]
data = np.random.randn(30).cumsum()

plt.plot(data,'k-',drawstyle='steps-post',label='steps-post')

[]
plt.plot(data,'k--',label='Default')
[]
plt.legend(loc='best')
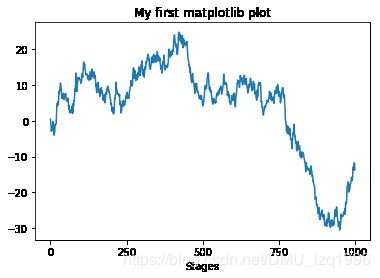
fig = plt.figure()
ax = fig.add_subplot(111)
ax.set_xticks([0,250,500,750,1000])
ax.set_title("My first matplotlib plot")
ax.set_xlabel('Stages')
ax.plot(np.random.randn(1000).cumsum())
[]
from numpy.random import randn
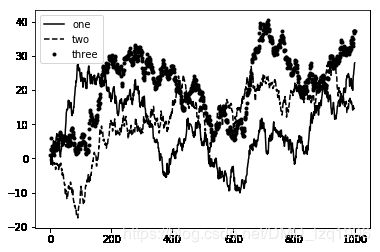
fig = plt.figure()
ax = fig.add_subplot(111)
ax.plot(randn(1000).cumsum(),'k',label='one')
ax.plot(randn(1000).cumsum(),'k--',label='two')
ax.plot(randn(1000).cumsum(),'k.',label='three')
ax.legend(loc='best')
from datetime import datetime
import pandas as pd
fig = plt.figure()
ax = fig.add_subplot(111)
data = pd.read_csv('examples/spx.csv',index_col=0,parse_dates=True)
spx = data['SPX']
spx.plot(ax=ax,style='k-')
crisis_data = [
(datetime(2007,10,11),'Peak of bull market'),
(datetime(2008,3,12),'Bear Stearns Fails'),
(datetime(2008,9,15),'Lehman Bankruptcy')
]
for date,label in crisis_data:
ax.annotate(label, xy=(date, spx.asof(date) + 75),
xytext=(date, spx.asof(date) + 225),
arrowprops=dict(facecolor='black', headwidth=4, width=2,
headlength=4),
horizontalalignment='left', verticalalignment='top')
ax.set_xlim(['1/1/2007', '1/1/2011'])
ax.set_ylim([600, 1800])
ax.set_title('Important dates in the 2008-2009 financial crisis')
Text(0.5,1,'Important dates in the 2008-2009 financial crisis')

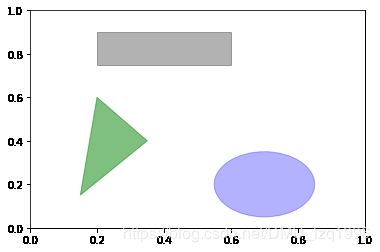
fig = plt.figure()
ax = fig.add_subplot(1, 1, 1)
rect = plt.Rectangle((0.2, 0.75), 0.4, 0.15, color='k', alpha=0.3)
circ = plt.Circle((0.7, 0.2), 0.15, color='b', alpha=0.3)
pgon = plt.Polygon([[0.15, 0.15], [0.35, 0.4], [0.2, 0.6]],
color='g', alpha=0.5)
ax.add_patch(rect)
ax.add_patch(circ)
ax.add_patch(pgon)
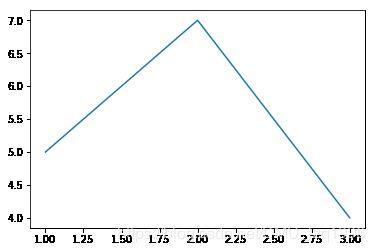
plt.plot([1,2,3],[5,7,4])
plt.show()
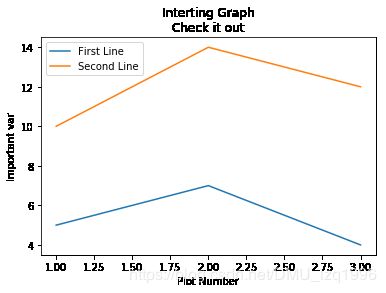
x = [1,2,3]
y = [5,7,4]
x2 = [1,2,3]
y2 = [10,14,12]
plt.plot(x,y,label='First Line')
plt.plot(x2,y2,label='Second Line')
plt.xlabel('Plot Number')
plt.ylabel('Important var')
plt.title('Interting Graph\nCheck it out')
plt.legend()
plt.show()
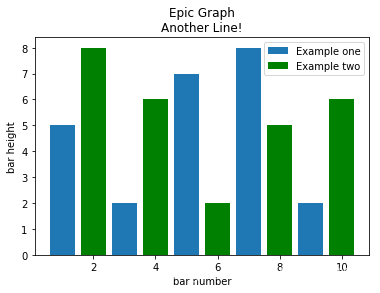
plt.bar([1,3,5,7,9],[5,2,7,8,2],label='Example one')
plt.bar([2,4,6,8,10],[8,6,2,5,6],label='Example two',color='g')
plt.legend()
plt.xlabel('bar number')
plt.ylabel('bar height')
plt.title('Epic Graph\nAnother Line!')
plt.show()
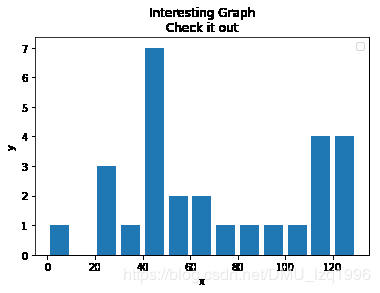
population_ages = [22,55,62,45,21,22,34,42,42,4,99,102,110,120,121,122,130,111,115,112,80,75,65,54,44,43,42,48]
bins = [0,10,20,30,40,50,60,70,80,90,100,110,120,130]

plt.hist(population_ages,bins,histtype = 'bar',rwidth=0.8)

plt.xlabel('x')
plt.ylabel('y')
plt.title("Interesting Graph\nCheck it out")
plt.legend()
plt.show()
x = [1,2,3,4,5,6,7,8]
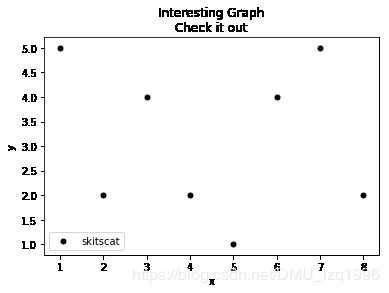
y = [5,2,4,2,1,4,5,2]
plt.scatter(x,y,label='skitscat',color='k',s=25,marker='o')
plt.xlabel('x')
plt.ylabel('y')
plt.title('Interesting Graph\nCheck it out')
plt.legend()
plt.show()
days = [1,2,3,4,5]
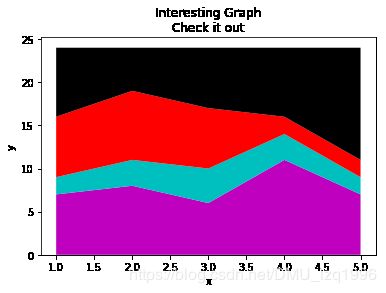
sleeping = [7,8,6,11,7]
eating = [2,3,4,3,2]
working = [7,8,7,2,2]
playing = [8,5,7,8,13]
plt.stackplot(days,sleeping,eating,working,playing,colors=['m','c','r','k'])
plt.xlabel('x')
plt.ylabel('y')
plt.title('Interesting Graph\nCheck it out')
plt.show()
days = [1,2,3,4,5]
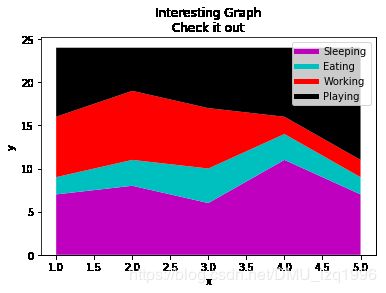
sleeping = [7,8,6,11,7]
eating = [2,3,4,3,2]
working = [7,8,7,2,2]
playing = [8,5,7,8,13]
plt.plot([],[],color='m',label='Sleeping',linewidth=5)
plt.plot([],[],color='c', label='Eating', linewidth=5)
plt.plot([],[],color='r', label='Working', linewidth=5)
plt.plot([],[],color='k', label='Playing', linewidth=5)
plt.stackplot(days,sleeping,eating,working,playing,colors=['m','c','r','k'])
plt.xlabel('x')
plt.ylabel('y')
plt.title('Interesting Graph\nCheck it out')
plt.legend()
plt.show()
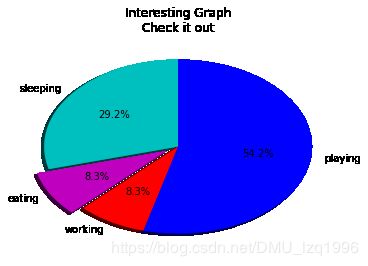
slices = [7,2,2,13]
activities = ['sleeping','eating','working','playing']
cols=['c','m','r','b']
plt.pie(slices,labels=activities,colors=cols,startangle=90,shadow=True,explode=(0,0.1,0,0),autopct='%1.1f%%')
plt.title('Interesting Graph\nCheck it out')
plt.show()
from mpl_toolkits.mplot3d import axes3d
import matplotlib.pyplot as plt
import numpy as np
from matplotlib import style
style.use('ggplot')
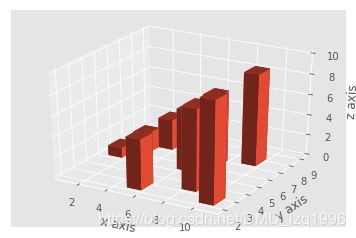
fig = plt.figure()
ax1 = fig.add_subplot(111, projection='3d')
x3 = [1,2,3,4,5,6,7,8,9,10]
y3 = [5,6,7,8,2,5,6,3,7,2]
z3 = np.zeros(10)
dx = np.ones(10)
dy = np.ones(10)
dz = [1,2,3,4,5,6,7,8,9,10]
ax1.bar3d(x3, y3, z3, dx, dy, dz)
ax1.set_xlabel('x axis')
ax1.set_ylabel('y axis')
ax1.set_zlabel('z axis')
plt.show()
from mpl_toolkits.mplot3d import axes3d
import matplotlib.pyplot as plt
from matplotlib import style

style.use('ggplot')

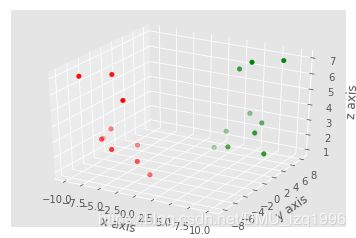
fig = plt.figure()
ax1 = fig.add_subplot(111, projection='3d')

x = [1,2,3,4,5,6,7,8,9,10]
y = [5,6,7,8,2,5,6,3,7,2]
z = [1,2,6,3,2,7,3,3,7,2]

x2 = [-1,-2,-3,-4,-5,-6,-7,-8,-9,-10]
y2 = [-5,-6,-7,-8,-2,-5,-6,-3,-7,-2]
z2 = [1,2,6,3,2,7,3,3,7,2]

ax1.scatter(x, y, z, c='g', marker='o')
ax1.scatter(x2, y2, z2, c ='r', marker='o')

ax1.set_xlabel('x axis')
ax1.set_ylabel('y axis')
ax1.set_zlabel('z axis')

plt.show()
from mpl_toolkits.mplot3d import axes3d
import matplotlib.pyplot as plt
import numpy as np
from matplotlib import style
style.use('ggplot')

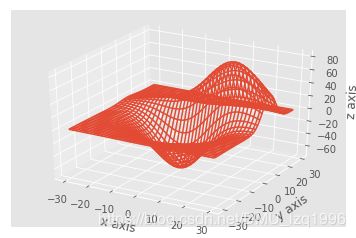
fig = plt.figure()
ax1 = fig.add_subplot(111, projection='3d')

x, y, z = axes3d.get_test_data()

print(axes3d.__file__)
ax1.plot_wireframe(x,y,z, rstride = 3, cstride = 3)

ax1.set_xlabel('x axis')
ax1.set_ylabel('y axis')
ax1.set_zlabel('z axis')

plt.show()
C:\Anaconda\lib\site-packages\mpl_toolkits\mplot3d\axes3d.py
from mpl_toolkits.mplot3d import axes3d
import matplotlib.pyplot as plot
import numpy as np
from matplotlib import style

x = np.linspace(-10, 10, 101)
y = x
x, y = np.meshgrid(x, y)
z = x ** 2 + y ** 2
ax = plot.subplot(111, projection='3d')
ax.plot_wireframe(x, y, z)
plot.show()

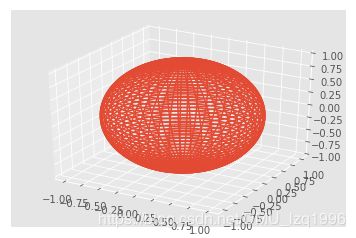
t = np.linspace(0, np.pi * 2, 100)
s = np.linspace(0, np.pi, 100)
t, s = np.meshgrid(t, s)
x = np.cos(t) * np.sin(s)
y = np.sin(t) * np.sin(s)
z = np.cos(s)
ax = plot.subplot(111, projection='3d')
ax.plot_wireframe(x, y, z)
plot.show()
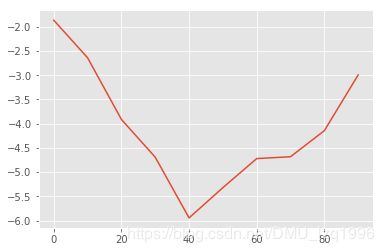
import pandas as pd
s = pd.Series(np.random.randn(10).cumsum(),index=np.arange(0,100,10))
s.plot()
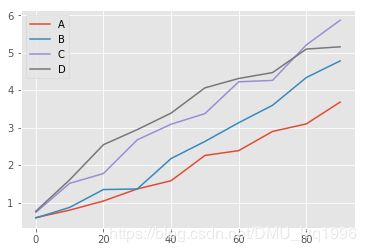
df = pd.DataFrame(np.random.rand(10,4).cumsum(0),
                 columns=['A','B','C','D'],
                 index = np.arange(0,100,10))
df
|
A |
B |
C |
D |
| 0 |
0.597104 |
0.589393 |
0.735777 |
0.767290 |
| 10 |
0.796663 |
0.869799 |
1.512095 |
1.604585 |
| 20 |
1.040885 |
1.346473 |
1.774127 |
2.543832 |
| 30 |
1.362510 |
1.362242 |
2.673032 |
2.946192 |
| 40 |
1.581508 |
2.174047 |
3.090430 |
3.386457 |
| 50 |
2.256305 |
2.629983 |
3.372889 |
4.060371 |
| 60 |
2.385461 |
3.130221 |
4.222364 |
4.311171 |
| 70 |
2.896483 |
3.595163 |
4.260149 |
4.468304 |
| 80 |
3.099516 |
4.335802 |
5.207953 |
5.096282 |
| 90 |
3.680995 |
4.779841 |
5.865332 |
5.155942 |
df.plot()
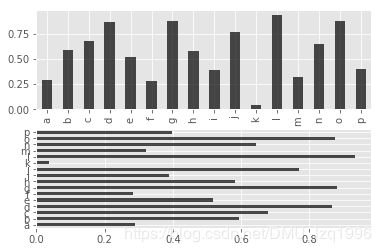
fig,axes = plt.subplots(2,1)
data = pd.Series(np.random.rand(16),index=list('abcdefghijklmnop'))
data.plot.bar(ax=axes[0],color='k',alpha=0.7)
data.plot.barh(ax=axes[1],color='k',alpha=0.7)
data = pd.DataFrame(np.random.rand(6,4),
index=['one','two','three','four','five','six'],
columns=pd.Index(list('ABCD'),name='Genus'))
data
| Genus |
A |
B |
C |
D |
| one |
0.594853 |
0.189521 |
0.130311 |
0.998033 |
| two |
0.247427 |
0.221326 |
0.663043 |
0.141174 |
| three |
0.398459 |
0.242788 |
0.112028 |
0.985286 |
| four |
0.365095 |
0.167354 |
0.545588 |
0.185118 |
| five |
0.024861 |
0.389038 |
0.277269 |
0.950699 |
| six |
0.708134 |
0.898126 |
0.259565 |
0.452563 |
data.plot.bar()

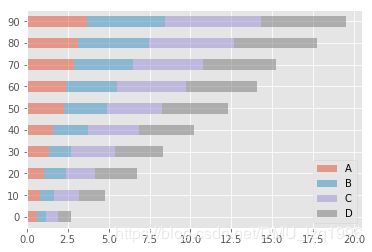
df.plot.barh(stacked=True, alpha=0.5)
tips = pd.read_csv('examples/tips.csv')
party_counts = pd.crosstab(tips['day'],tips['size'])
party_counts
| size |
1 |
2 |
3 |
4 |
5 |
6 |
| day |
|
|
|
|
|
|
| Fri |
1 |
16 |
1 |
1 |
0 |
0 |
| Sat |
2 |
53 |
18 |
13 |
1 |
0 |
| Sun |
0 |
39 |
15 |
18 |
3 |
1 |
| Thur |
1 |
48 |
4 |
5 |
1 |
3 |
party_counts = party_counts.loc[:,2:5]
party_pcts = party_counts.div(party_counts.sum(1),axis =0)
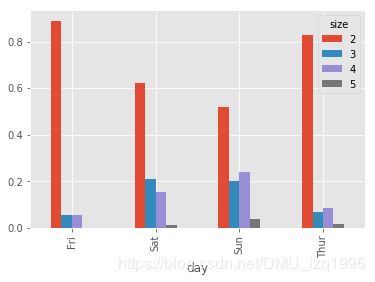
party_pcts
| size |
2 |
3 |
4 |
5 |
| day |
|
|
|
|
| Fri |
0.888889 |
0.055556 |
0.055556 |
0.000000 |
| Sat |
0.623529 |
0.211765 |
0.152941 |
0.011765 |
| Sun |
0.520000 |
0.200000 |
0.240000 |
0.040000 |
| Thur |
0.827586 |
0.068966 |
0.086207 |
0.017241 |
party_pcts.plot.bar()
import seaborn as sns
tips['tip_pct'] = tips['tip'] / (tips['total_bill'] - tips['tip'])
tips.head()
|
total_bill |
tip |
smoker |
day |
time |
size |
tip_pct |
| 0 |
16.99 |
1.01 |
No |
Sun |
Dinner |
2 |
0.063204 |
| 1 |
10.34 |
1.66 |
No |
Sun |
Dinner |
3 |
0.191244 |
| 2 |
21.01 |
3.50 |
No |
Sun |
Dinner |
3 |
0.199886 |
| 3 |
23.68 |
3.31 |
No |
Sun |
Dinner |
2 |
0.162494 |
| 4 |
24.59 |
3.61 |
No |
Sun |
Dinner |
4 |
0.172069 |
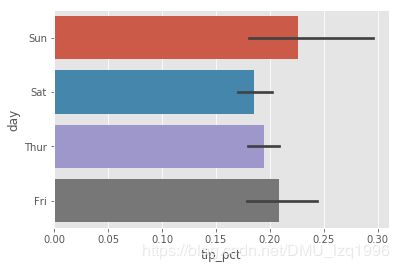
sns.barplot(x='tip_pct',y='day',data=tips,orient='h')
C:\Anaconda\lib\site-packages\scipy\stats\stats.py:1713: FutureWarning: Using a non-tuple sequence for multidimensional indexing is deprecated; use `arr[tuple(seq)]` instead of `arr[seq]`. In the future this will be interpreted as an array index, `arr[np.array(seq)]`, which will result either in an error or a different result.
  return np.add.reduce(sorted[indexer] * weights, axis=axis) / sumval
sns.barplot(x='tip_pct', y='day', hue='time', data=tips, orient='h')
C:\Anaconda\lib\site-packages\scipy\stats\stats.py:1713: FutureWarning: Using a non-tuple sequence for multidimensional indexing is deprecated; use `arr[tuple(seq)]` instead of `arr[seq]`. In the future this will be interpreted as an array index, `arr[np.array(seq)]`, which will result either in an error or a different result.
  return np.add.reduce(sorted[indexer] * weights, axis=axis) / sumval

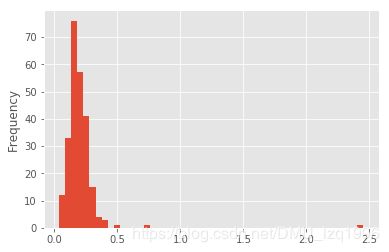
tips['tip_pct'].plot.hist(bins=50)
tips['tip_pct'].plot.density()
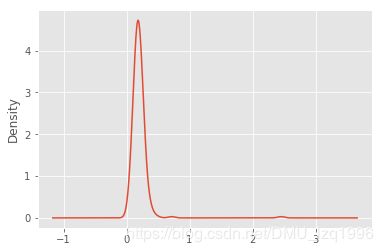
comp1 = np.random.normal(0,1,size=200)
comp2 = np.random.normal(10,2,size=200)
values = pd.Series(np.concatenate([comp1,comp2]))
sns.distplot(values,bins=100,color='k')
C:\Anaconda\lib\site-packages\scipy\stats\stats.py:1713: FutureWarning: Using a non-tuple sequence for multidimensional indexing is deprecated; use `arr[tuple(seq)]` instead of `arr[seq]`. In the future this will be interpreted as an array index, `arr[np.array(seq)]`, which will result either in an error or a different result.
  return np.add.reduce(sorted[indexer] * weights, axis=axis) / sumval

macro = pd.read_csv('examples/macrodata.csv')
data = macro[['cpi', 'm1', 'tbilrate', 'unemp']]
trans_data = np.log(data).diff().dropna()
trans_data[-5:]
|
cpi |
m1 |
tbilrate |
unemp |
| 198 |
-0.007904 |
0.045361 |
-0.396881 |
0.105361 |
| 199 |
-0.021979 |
0.066753 |
-2.277267 |
0.139762 |
| 200 |
0.002340 |
0.010286 |
0.606136 |
0.160343 |
| 201 |
0.008419 |
0.037461 |
-0.200671 |
0.127339 |
| 202 |
0.008894 |
0.012202 |
-0.405465 |
0.042560 |
sns.regplot('m1','unemp',data=trans_data)
plt.title('changes in log %s versus log %s'%('m1','unemp'))
C:\Anaconda\lib\site-packages\scipy\stats\stats.py:1713: FutureWarning: Using a non-tuple sequence for multidimensional indexing is deprecated; use `arr[tuple(seq)]` instead of `arr[seq]`. In the future this will be interpreted as an array index, `arr[np.array(seq)]`, which will result either in an error or a different result.
  return np.add.reduce(sorted[indexer] * weights, axis=axis) / sumval


Text(0.5,1,'changes in log m1 versus log unemp')
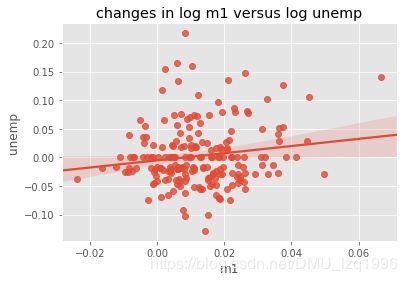
sns.pairplot(trans_data, diag_kind='kde', plot_kws={'alpha': 0.2})
C:\Anaconda\lib\site-packages\scipy\stats\stats.py:1713: FutureWarning: Using a non-tuple sequence for multidimensional indexing is deprecated; use `arr[tuple(seq)]` instead of `arr[seq]`. In the future this will be interpreted as an array index, `arr[np.array(seq)]`, which will result either in an error or a different result.
  return np.add.reduce(sorted[indexer] * weights, axis=axis) / sumval
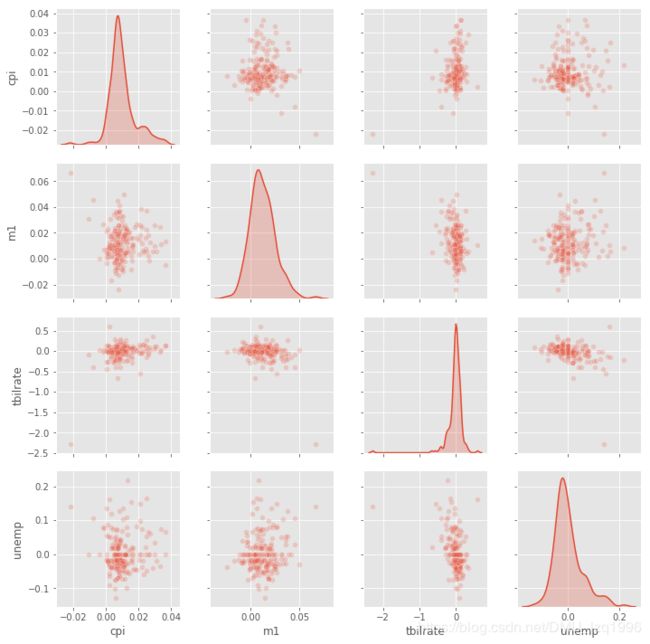
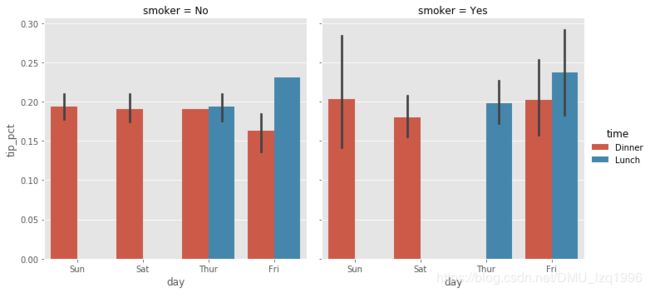
sns.factorplot(x='day', y='tip_pct', hue='time', col='smoker',
kind='bar', data=tips[tips.tip_pct < 1])
C:\Anaconda\lib\site-packages\seaborn\categorical.py:3666: UserWarning: The `factorplot` function has been renamed to `catplot`. The original name will be removed in a future release. Please update your code. Note that the default `kind` in `factorplot` (`'point'`) has changed `'strip'` in `catplot`.
  warnings.warn(msg)
C:\Anaconda\lib\site-packages\scipy\stats\stats.py:1713: FutureWarning: Using a non-tuple sequence for multidimensional indexing is deprecated; use `arr[tuple(seq)]` instead of `arr[seq]`. In the future this will be interpreted as an array index, `arr[np.array(seq)]`, which will result either in an error or a different result.
  return np.add.reduce(sorted[indexer] * weights, axis=axis) / sumval
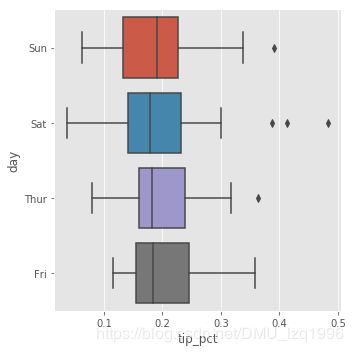
sns.factorplot(x='tip_pct', y='day', kind='box',
data=tips[tips.tip_pct < 0.5])
C:\Anaconda\lib\site-packages\seaborn\categorical.py:3666: UserWarning: The `factorplot` function has been renamed to `catplot`. The original name will be removed in a future release. Please update your code. Note that the default `kind` in `factorplot` (`'point'`) has changed `'strip'` in `catplot`.
  warnings.warn(msg)
