之前的步骤参考:
https://www.jianshu.com/p/aeffb9791572
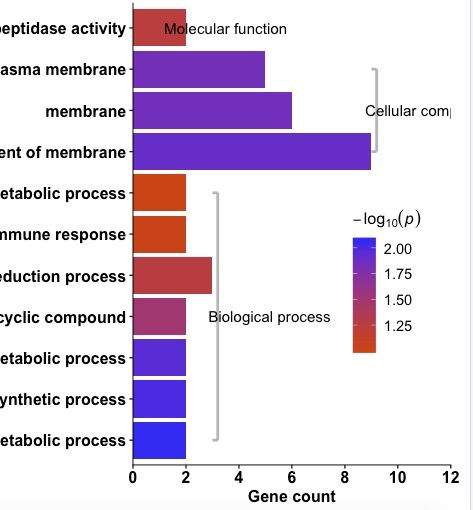
用David得到了数据,接下来画几张美丽的图。GO有三个部分,BP,CC, MF。一般我们使用BP。但是这里我们想把三个部分都展示在图片当中。
rm(list=ls())
library(ggplot2)
library(Cairo)
library(grid)

GO_BP <- read.table("Term.txt",header = T,sep="\t")
GO_BP <- within(GO_BP,{Term <- factor(Term, levels = GO_BP$Term)})
tiff(filename = "GO_up1.tiff",
     width = 3000, height = 2000, units = "px",res = 300,compression = "lzw")
plot <- ggplot(data=GO_BP)+
  geom_bar(aes(x=Term,y=Count, fill=-log10(PValue)), stat='identity') +
  coord_flip() +
  scale_fill_gradient(expression(-log["10"](italic(p))),low="red", high = "blue") +
  scale_y_continuous(expand=c(0, 0), limits=c(0,12), breaks = c(seq(0, 12, 2)))+
  theme(
    panel.background = element_rect(fill = "transparent",colour = NA),
   # panel.border = element_blank(),
   # panel.grid.minor = theme_blank(),
    plot.margin=unit(rep(1,4), 'lines'),
    #panel.grid.minor = element_line(colour = "black"),
  #  panel.grid.major = element_line(color = "black"),
    axis.line.y = element_line(colour = "black"),
    axis.line.x = element_line(colour = "black"),
    axis.title.x = element_text(size=12,color='black',face='bold'),
    axis.title.y = element_text(size=12,color='black',face='bold'),
    axis.text.x = element_text(size=12,color='black',face='bold'),
    axis.text.y = element_text(size=12,color='black',face='bold'),
    legend.text=element_text(color="black",size=rel(1.0)),
    legend.title = element_text(color="black",size=rel(1.1)),
    legend.position=c(0.8,0.4)
    # legend.position="top",
  )  +  annotate('segment', x=1, xend=7, y=3.2, yend=3.2, col = "gray", size = 1) +
  annotate('segment', x=1, xend=1, y=3.0, yend=3.2, col = "gray", size = 1) +
  annotate('segment', x= 7, xend=7, y=3.0, yend=3.2, col = "gray", size = 1) +
  annotate("text",x=4, y = 4, label= "Biological process", hjust = 0.25, col = "black", size = 4) +
  annotate('segment', x=8, xend=10, y=9.2, yend=9.2, col = "gray", size = 1) +
  annotate('segment', x=8, xend=8, y=9, yend=9.2, col = "gray", size = 1) +
  annotate("text",x=9, y = 10, label= "Cellular component", hjust = 0.25, col = "black", size = 4) +
  annotate("text",x=11, y = 3.5, label= "Molecular function",  col = "black", size = 4)
