Python基础篇—Pandas应用(一)
下面结合一个具体案例进一步了解pandas的应用。参考文章pandas-cookbook GitHub repository
在此,我们将利用一个新的数据集来演示如何用pandas处理更大的数据集。通过分析该数据集,找到最常见的投诉类型(数据可在GitHub上下载)。
导入数据
首先来导入相关的库,并设置好参数:
# The usual preamble
%matplotlib inline
import pandas as pd
import matplotlib.pyplot as plt

# Make the graphs a bit prettier, and bigger
pd.set_option('display.mpl_style', 'default')

# This is necessary to show lots of columns in pandas 0.12.
# Not necessary in pandas 0.13.
pd.set_option('display.width', 5000)
pd.set_option('display.max_columns', 60)

plt.rcParams['figure.figsize'] = (15, 5)
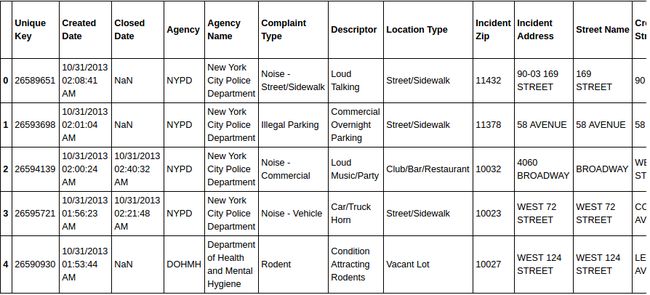
导入并查看数据。由于数据量较大,我们不可能显示出所有数据,但可查看部分数据:
complaints = pd.read_csv(u'/home/hadoop/下载/pandas-cookbook-master/data/311-service-requests.csv')
complaints.head(5)#显示前5行数据选择行和列
比如我们要选择出Complaint Type这一列,通过下面命令来选择:
complaints['Complaint Type']输出:
0          Noise - Street/Sidewalk
1                  Illegal Parking
2               Noise - Commercial
3                  Noise - Vehicle
4                           Rodent
5               Noise - Commercial
6                 Blocked Driveway
7               Noise - Commercial
8               Noise - Commercial
9               Noise - Commercial
10        Noise - House of Worship
11              Noise - Commercial
12                 Illegal Parking
13                 Noise - Vehicle
14                          Rodent
15        Noise - House of Worship
16         Noise - Street/Sidewalk
17                 Illegal Parking
18          Street Light Condition
19              Noise - Commercial
20        Noise - House of Worship
21              Noise - Commercial
22                 Noise - Vehicle
23              Noise - Commercial
24                Blocked Driveway
25         Noise - Street/Sidewalk
26          Street Light Condition
27            Harboring Bees/Wasps
28         Noise - Street/Sidewalk
29          Street Light Condition
                    ...
111039          Noise - Commercial
111040          Noise - Commercial
111041                       Noise
111042     Noise - Street/Sidewalk
111043          Noise - Commercial
111044     Noise - Street/Sidewalk
111045                Water System
111046                       Noise
111047             Illegal Parking
111048     Noise - Street/Sidewalk
111049          Noise - Commercial
111050                       Noise
111051          Noise - Commercial
111052                Water System
111053           Derelict Vehicles
111054     Noise - Street/Sidewalk
111055          Noise - Commercial
111056       Street Sign - Missing
111057                       Noise
111058          Noise - Commercial
111059     Noise - Street/Sidewalk
111060                       Noise
111061          Noise - Commercial
111062                Water System
111063                Water System
111064     Maintenance or Facility
111065             Illegal Parking
111066     Noise - Street/Sidewalk
111067          Noise - Commercial
111068            Blocked Driveway
Name: Complaint Type, dtype: object
选择多个列
如果我们只想选择complaint type和borough这两个列的信息不需要其他列,pandas可以很容易做到这一点:
complaints[['Complaint Type', 'Borough']][:10]#查看前10行数据找出最常见的投诉类型
用pandas的“.value_counts() ”函数来解决这个问题十分简单:
complaints['Complaint Type'].value_counts()来看看结果吧:
HEATING                                 14200
GENERAL CONSTRUCTION                     7471
Street Light Condition                   7117
DOF Literature Request                   5797
PLUMBING                                 5373
PAINT - PLASTER                          5149
Blocked Driveway                         4590
NONCONST                                 3998
Street Condition                         3473
Illegal Parking                          3343
Noise                                    3321
Traffic Signal Condition                 3145
Dirty Conditions                         2653
Water System                             2636
Noise - Commercial                       2578
ELECTRIC                                 2350
Broken Muni Meter                        2070
Noise - Street/Sidewalk                  1928
Sanitation Condition                     1824
Rodent                                   1632
Sewer                                    1627
Consumer Complaint                       1227
Taxi Complaint                           1227
Damaged Tree                             1180
Overgrown Tree/Branches                  1083
Missed Collection (All Materials)         973
Graffiti                                  973
Building/Use                              942
Root/Sewer/Sidewalk Condition             836
Derelict Vehicle                          803
                                        ...
Internal Code                               5
Posting Advertisement                       5
Fire Alarm - Modification                   5
Miscellaneous Categories                    5
Poison Ivy                                  5
Illegal Animal Sold                         4
Transportation Provider Complaint           4
Special Natural Area District (SNAD)        4
Ferry Complaint                             4
Adopt-A-Basket                              3
Invitation                                  3
Fire Alarm - Replacement                    3
Illegal Fireworks                           3
Misc. Comments                              2
Public Assembly                             2
Opinion for the Mayor                       2
Window Guard                                2
DFTA Literature Request                     2
Legal Services Provider Complaint           2
Open Flame Permit                           1
Snow                                        1
Municipal Parking Facility                  1
X-Ray Machine/Equipment                     1
Stalled Sites                               1
DHS Income Savings Requirement              1
Tunnel Condition                            1
Highway Sign - Damaged                      1
Ferry Permit                                1
Trans Fat                                   1
DWD                                         1
Name: Complaint Type, dtype: int64
如果我们只是想要10大最常见的投诉,可以这样做:
complaint_counts = complaints['Complaint Type'].value_counts()
complaint_counts[:10]
输出:
HEATING                   14200
GENERAL CONSTRUCTION       7471
Street Light Condition     7117
DOF Literature Request     5797
PLUMBING                   5373
PAINT - PLASTER            5149
Blocked Driveway           4590
NONCONST                   3998
Street Condition           3473
Illegal Parking            3343
Name: Complaint Type, dtype: int64
可视化查看
为了直观地查看,我们可以使用直方图展示效果:
complaint_counts[:10].plot(kind='bar')输出:

从中我们可以清楚地看出,关于供暖问题的投诉是最多的。
找出哪个区的噪声投诉最多
首先要得到噪声投诉的数据,为此我们需要在数据集中找到列标签为“Complaint Type”的列,然后从中选择出行标签为“noise - Street/Sidewalk”行。下面演示用pandas如何操作:
noise_complaints = complaints[complaints['Complaint Type'] == "Noise - Street/Sidewalk"]
noise_complaints[:3]
输出:

现在可以看到,“Complaint Type”投诉的类型都是噪声投诉。
或者我们也可以换另一种方式:
complaints['Complaint Type'] == "Noise - Street/Sidewalk"输出:
0          True
1         False
2         False
3         False
4         False
5         False
6         False
7         False
8         False
9         False
10        False
11        False
12        False
13        False
14        False
15        False
16         True
17        False
18        False
19        False
20        False
21        False
22        False
23        False
24        False
25         True
26        False
27        False
28         True
29        False
          ...
111039    False
111040    False
111041    False
111042     True
111043    False
111044     True
111045    False
111046    False
111047    False
111048     True
111049    False
111050    False
111051    False
111052    False
111053    False
111054     True
111055    False
111056    False
111057    False
111058    False
111059     True
111060    False
111061    False
111062    False
111063    False
111064    False
111065    False
111066     True
111067    False
111068    False
Name: Complaint Type, dtype: bool
这样就将投诉类型为噪声投诉的行标记为”True”,非噪声投诉的标记为”False”,并转化为了布尔类型。接着再执行:
complaints[is_noise][:3]这样得到的结果和上面一样。
此外,也可以使用该方法选择出多个满足条件的列。比如说,我们要选择出在”BROOKLYN”(布鲁克林)区的噪声投诉的信息:
is_noise = complaints['Complaint Type'] == "Noise - Street/Sidewalk"
in_brooklyn = complaints['Borough'] == "BROOKLYN"
complaints[is_noise & in_brooklyn][:5]complaints[is_noise & in_brooklyn][['Complaint Type', 'Borough', 'Created Date', 'Descriptor']][:5]看看结果吧:

这是”BROOKLYN”区的噪声投诉的信息。那么,究竟是哪一个区的噪声投诉问题最严重呢?我们继续探讨:
is_noise = complaints['Complaint Type'] == "Noise - Street/Sidewalk"
noise_complaints = complaints[is_noise]
noise_complaints['Borough'].value_counts()
输出:
MANHATTAN        917
BROOKLYN         456
BRONX            292
QUEENS           226
STATEN ISLAND     36
Unspecified        1
Name: Borough, dtype: int64
OK!这里是6个区的统计结果。是的!“MANHATTAN”(曼哈顿)区的噪声投诉是最为严重的!进一步整理,得到可视化的结果:
noise_complaint_counts = noise_complaints['Borough'].value_counts()
complaint_counts = complaints['Borough'].value_counts()
noise_complaint_counts / complaint_counts.astype(float)
(noise_complaint_counts / complaint_counts.astype(float)).plot(kind='bar')


