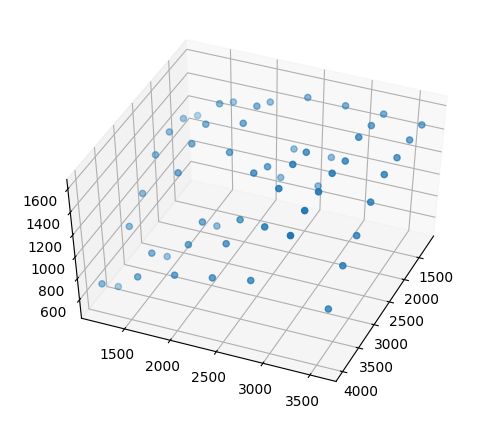
本来要做三维插值的,类似于等高线之类的,但是不会做,只做出来了三维散点图
import matplotlib.pyplot as plt
from mpl_toolkits.mplot3d import Axes3D
from numpy import interp
#import scipy.interpolate as itp
fig = plt.figure()
ax = fig.add_subplot(111, projection='3d')
X = [x for x in range(1200,4400,400) for y in range(0,7)]
Y = [x for x in range(1200,4000,400)]*8
Z=[1130,1320,1390,1500,1500,1500,1480,1250,1450,1500,1200,1200,1550,1500,1280,1420,1500,1100,1100,1600,1500,1230,1400,1400,1350,1550,1550,1510,1040,1300,900,1450,1600,1600,1430,900,700,1100,1200,1550,1600,1300,500,900,1060,1150,1380,1600,1200,700,850,950,1010,1070,1550,980]
print(len(Z))
ax.scatter(X,Y, Z)
plt.show()
print(X)
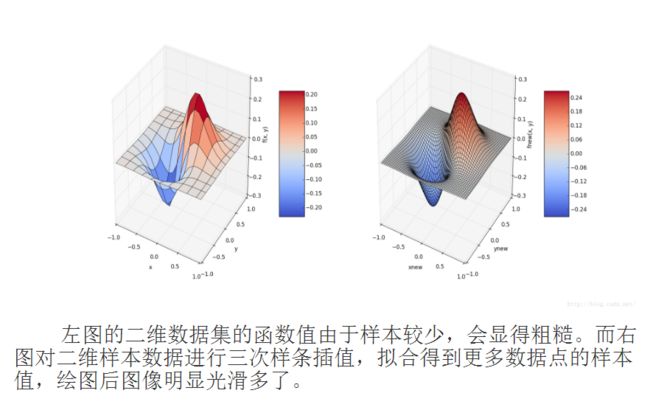
看了别人的一个例子转自http://blog.csdn.net/huozi07/article/details/50538749
"""
演示二维插值。
"""
# -*- coding: utf-8 -*-
import numpy as np
from mpl_toolkits.mplot3d import Axes3D
import matplotlib as mpl
from scipy import interpolate
import matplotlib.cm as cm
import matplotlib.pyplot as plt

def func(x, y):
    return (x+y)*np.exp(-5.0*(x**2 + y**2))

# X-Y轴分为20*20的网格
x = np.linspace(-1, 1, 20)
y = np.linspace(-1,1,20)
x, y = np.meshgrid(x, y)#20*20的网格数据

fvals = func(x,y) # 计算每个网格点上的函数值  15*15的值

fig = plt.figure(figsize=(9, 6))
#Draw sub-graph1
ax=plt.subplot(1, 2, 1,projection = '3d')
surf = ax.plot_surface(x, y, fvals, rstride=2, cstride=2, cmap=cm.coolwarm,linewidth=0.5, antialiased=True)
ax.set_xlabel('x')
ax.set_ylabel('y')
ax.set_zlabel('f(x, y)')
plt.colorbar(surf, shrink=0.5, aspect=5)#标注

#二维插值
newfunc = interpolate.interp2d(x, y, fvals, kind='cubic')#newfunc为一个函数

# 计算100*100的网格上的插值
xnew = np.linspace(-1,1,100)#x
ynew = np.linspace(-1,1,100)#y
fnew = newfunc(xnew, ynew)#仅仅是y值   100*100的值  np.shape(fnew) is 100*100
xnew, ynew = np.meshgrid(xnew, ynew)
ax2=plt.subplot(1, 2, 2,projection = '3d')
surf2 = ax2.plot_surface(xnew, ynew, fnew, rstride=2, cstride=2, cmap=cm.coolwarm,linewidth=0.5, antialiased=True)
ax2.set_xlabel('xnew')
ax2.set_ylabel('ynew')
ax2.set_zlabel('fnew(x, y)')
plt.colorbar(surf2, shrink=0.5, aspect=5)#标注

plt.show()

