ELK + Redis
Window7
Oracle JDK8
Redis: Redis-x64-3.2.100 for windows
Elasticsearch: elasticsearch-2.3.4
Logstash: logstash-2.3.4
Kibana: kibana-4.5.2-windows
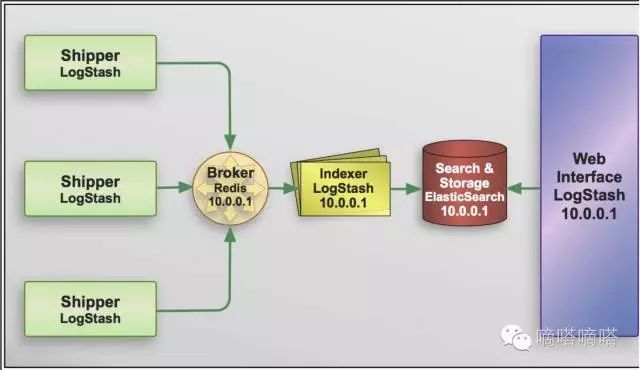
Paste_Image.png
安装
Redis
- 解压Redis-x64-3.2.100,可以在安装相同目录看到一些文档。
- 切到bin目录,运行redis-server --service-install redis.windows-service.conf --loglevel verbose安装service
- 编辑redis.windows-service.conf和redis.windows.conf修改bind到ip(不然远程连接不了)
- 启动服务redis,默认端口为6379,配置在redis.windows-service.conf文件里
- 启动后可以在目录里找到server_log
- 可以用redis-cli monitor来简单的查看debug信息
Elasticsearch
- 解压elasticsearch-2.3.4
- 切到bin目录,运行service install
- 启动服务elasticsearch-service-x64
- 可选:运行service manager启动GUI配置服务
- 打开\elasticsearch-2.3.4\config\elasticsearch.yml,配置两个属性network.host和http.port,前一个是机器的ip,后一个是端口,配置完成后重启
- 访问:http://xxx:xxx/?pretty,看到如下信息就说明启动成功了
{
  "name" : "Dmitri Smerdyakov",
  "cluster_name" : "elasticsearch",
  "version" : {
    "number" : "2.3.4",
    "build_hash" : "e455fd0c13dceca8dbbdbb1665d068ae55dabe3f",
    "build_timestamp" : "2016-06-30T11:24:31Z",
    "build_snapshot" : false,
    "lucene_version" : "5.5.0"
  },
  "tagline" : "You Know, for Search"
}
- 可以在elasticsearch-2.3.4\logs目录查看log
- 其他配置
- data和log的路径,cluster和node,memory
# ---------------------------------- Cluster -----------------------------------
#
# Use a descriptive name for your cluster:
#
# cluster.name: my-application
#
# ------------------------------------ Node ------------------------------------
#
# Use a descriptive name for the node:
#
# node.name: node-1
#
# Add custom attributes to the node:
#
# node.rack: r1
#
# ----------------------------------- Paths ------------------------------------
#
# Path to directory where to store the data (separate multiple locations by comma):
#
# path.data: /path/to/data
#
# Path to log files:
#
# path.logs: /path/to/logs
#
# ----------------------------------- Memory -----------------------------------
#
# Lock the memory on startup:
#
# bootstrap.mlockall: true
#
# Make sure that the `ES_HEAP_SIZE` environment variable is set to about half the memory
# available on the system and that the owner of the process is allowed to use this limit.
#
# Elasticsearch performs poorly when the system is swapping the memory.
- 安装插件
- elasticsearch-kopf: 从releases页面下载2.1.2:https://github.com/lmenezes/elasticsearch-kopf/releases
- 切到bin目录,运行plugin install file:///.../elasticsearch-kopf-2.1.2.zip(注意修改路径)
- 安装完成后可以看到elasticsearch-2.3.4\plugins\kopf
- 访问: http://xxx:xxx/_plugin/kopf, 例如:http://9.110.74.130:9200/_plugin/kopf
Logstash
- 配置shipper,以下实例是收集was的system out log,输出的Redis
logstash-test-was.outlog.conf

input {
    file {
        path => ["C:/IBM/ODM871/WAS/AppServer/profiles/ODMSample8711/logs/SamplesServer/SystemOut.log"]
        type => "websphere"
        start_position => beginning
    }
}
filter {
    # Combine lines that do not start with "[" with the previous message
    multiline {
        pattern => "^\["
        negate => true
        what => "previous"
    }
    if [message] =~ /.java:\d/ {
        mutate {
            add_tag => ["exception", "trace"]
        }
    }
}
output {
    redis {
        host => '9.110.74.130'
        port => '6379'
        data_type => 'list'
        key => 'logstash:redis'
    }
}
- 切到bin目录,运行logstash agent -f logstash-test-was.outlog.conf
- 配置服务端,input为redis,output为elasticsearch
input {
    file {
        path => ["C:/IBM/ODM871/WAS/AppServer/profiles/ODMSample8711/logs/SamplesServer/SystemOut.log"]
        type => "websphere"
        start_position => beginning
    }
}

output {
    redis {
        host => '9.110.74.130'
        port => '6379'
        data_type => 'list'
        key => 'logstash:redis'
    }
}
Kibana
- 解压kibana-4.5.2-windows.zip
- 切到kibana-4.5.2-windows\config打开kibana.yml设置
# Kibana is served by a back end server. This controls which port to use.
 server.port: 5601

# The host to bind the server to.
 server.host: "9.110.74.130"

# If you are running kibana behind a proxy, and want to mount it at a path,
# specify that path here. The basePath can't end in a slash.
# server.basePath: ""

# The maximum payload size in bytes on incoming server requests.
# server.maxPayloadBytes: 1048576

# The Elasticsearch instance to use for all your queries.
 elasticsearch.url: "http://localhost:9200"
- 访问: http://xxx:xxx,例如:http://9.110.74.130:5601
- 分类:异常消息?
- 自动刷新
- filter
- dashboard
各种日志文件的配置
TBD
websphere
liberty
tomcat
input {
    file {
        path =>"/var/lib/tomcat7/logs/localhost_access_log.txt"
        start_position =>"beginning"
    }
}
filter {
    grok {
        match => { "message" => "%{COMMONAPACHELOG}" }
    }
    date    {
        match => ["timestamp","dd/MMM/yyyy:HH:mm:ss Z"]
    }
    mutate {
        convert => ["response","integer"]
    convert => ["bytes","integer"]
    }
}
    output {
        elasticsearch {
        host => "localhost"
    }
}
运维
- Redis:数据的过期和持久化?cluster?
- Elasticsearch:数据的持久华?cluster?
参考
- "Learning ELK Stack"
- 白话 IT 之浅谈 ELK 日志系统
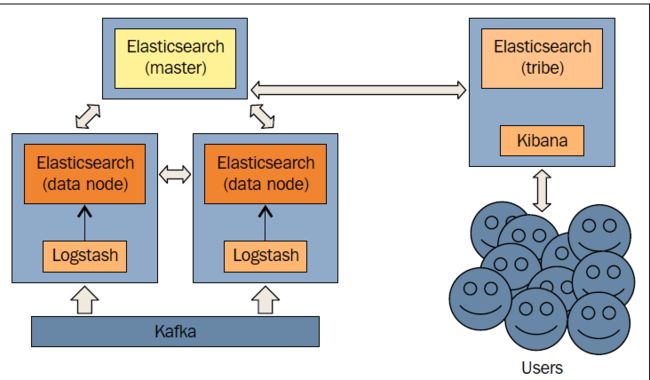
- ELK at LinkedIn - Kafka, scaling, lessons learned
Paste_Image.png