独立成分分析(Independent Components Analysis)
首先我们对ICA算法做一些形式化的描述:
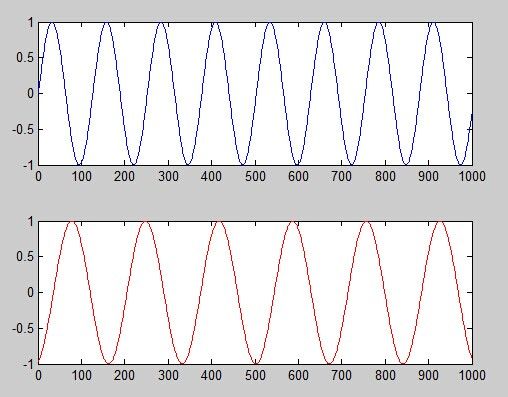
ICA是用来分离混合源的技术。所以我们准备先混合,再分离,我们定义两个独立的源,上面的称为A,下面的称为B,代码如下:
A = sin(linspace(0,50, 1000));   % A
B = sin(linspace(0,37, 1000)+5); % B
figure;
subplot(2,1,1); plot(A);         % plot A
subplot(2,1,2); plot(B, 'r');    % plot B

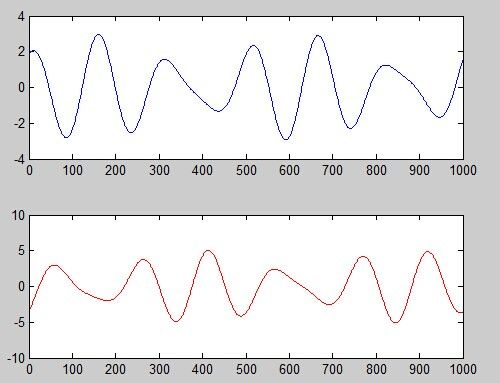
M1 = A - 2*B;                  % mixing 1
M2 = 1.73*A+3.41*B;            % mixing 2
figure;
subplot(2,1,1); plot(M1);      % plot mixing 1
subplot(2,1,2); plot(M2, 'r'); % plot mixing 2

figure;
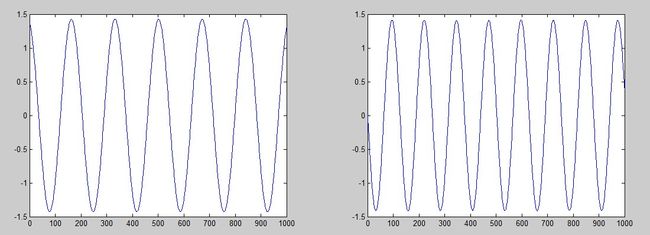
c = fastica([M1;M2]);              % compute and plot unminxing using fastICA
subplot(1,2,1); plot(c(1,:));
subplot(1,2,2); plot(c(2,:));
然后我们将其线性混合,上面的为A - 2*B下面的为1.73*A+3.41*B
之后使用fastica函数,就将两个源分开了:
完整的工程在这里下载:http://research.ics.aalto.fi/ica/fastica/code/dlcode.html
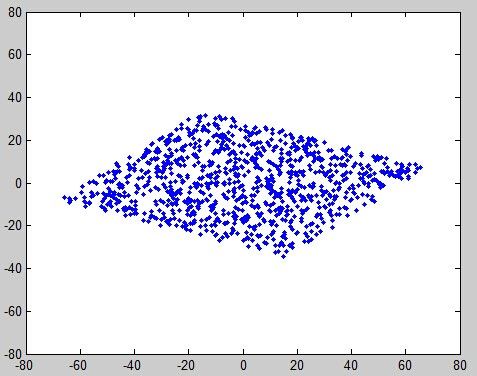
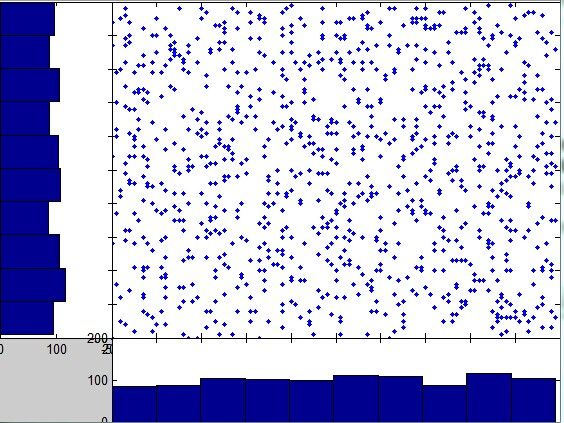
当然,在真正使用ICA算法之前,通常要白噪声化数据,意思是删除掉数据中所有的相关性。一个几何的解释是,恢复数据最初的形状,然后ICA只是旋转结果矩阵(如下图),混合两个随机的源A和B,A是数据的横坐标,B是数据的纵坐标:
混合A和B
白噪声化:
现在每一个坐标轴上的方差都相等,数据在每一个坐标轴上的映射的相关系数为0,意味着协方差矩阵是对角矩阵,而且每一个值都相等。然后应用ICA算法将这些表达旋转到原始的A和B的坐标轴空间。然后通过最小化数据映射到每个坐标轴上的高斯性来实现旋转:
可以看出之前每个坐标轴都展现了很好的高斯性,旋转后高斯性最小:
代码如下:
POINTS = 1000; % number of points to plot

% define the two random variables
% -------------------------------
for i=1:POINTS
	A(i) = round(rand*99)-50;              % A
	B(i) = round(rand*99)-50;              % B
end;
figure; plot(A,B, '.');                        % plot the variables
set(gca, 'xlim', [-80 80], 'ylim', [-80 80]);  % redefines limits of the graph

% mix linearly these two variables
% --------------------------------
M1 = 0.54*A - 0.84*B;                          % mixing 1
M2 = 0.42*A + 0.27*B;                          % mixing 2
figure; plot(M1,M2, '.');                      % plot the mixing
set(gca, 'ylim', get(gca, 'xlim'));            % redefines limits of the graph

% withen the data
% ---------------
x = [M1;M2];
c=cov(x')		 % covariance
sq=inv(sqrtm(c));        % inverse of square root
mx=mean(x');             % mean
xx=x-mx'*ones(1,POINTS); % subtract the mean
xx=2*sq*xx;
cov(xx')                 % the covariance is now a diagonal matrix
figure; plot(xx(1,:), xx(2,:), '.');

% show projections
% ----------------
figure;
axes('position', [0.2 0.2 0.8 0.8]); plot(xx(1,:), xx(2,:), '.'); hold on;
axes('position', [0   0.2 0.2 0.8]); hist(xx(1,:));  set(gca, 'view', [90 90]);
axes('position', [0.2 0   0.8 0.2]); hist(xx(2,:));

% show projections
% ----------------
figure;
axes('position', [0.2 0.2 0.8 0.8]); plot(A,B, '.'); hold on;
axes('position', [0   0.2 0.2 0.8]); hist(A);  set(gca, 'view', [90 90]);
axes('position', [0.2 0   0.8 0.2]); hist(B);
ICA算法有两个主要的应用问题,一个是股票市场的回报,一个是鸡尾酒晚会问题。
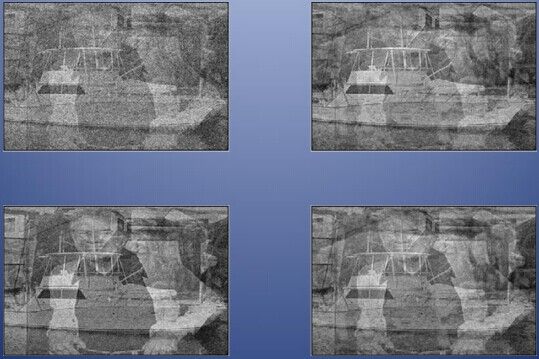
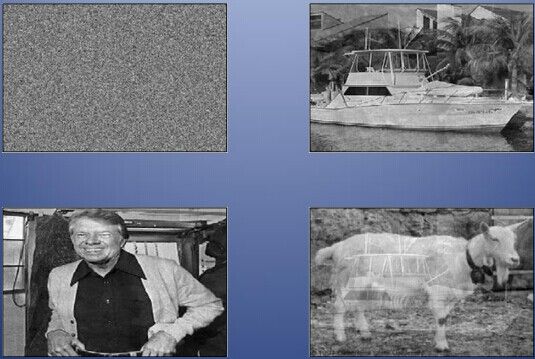
先看一个例子,四个信号的四个线性组合:
接下来是主成分分析的结果:
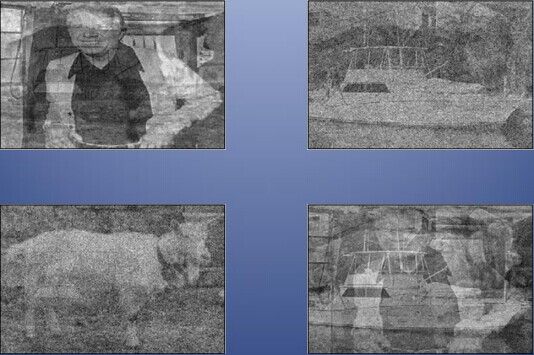
独立成分分析的结果:
ICA的流程:
首先,假设存在独立的源:![]()
然后只观察他们的线性组合:![]()
但是A和S都是未知的,A被称为混合矩阵
我们的目标是从Y(t)中恢复出原始的信号S(t),寻找一个矩阵L,为A的逆,有LY(t) = S(t)。
之后,摆脱掉相关性:白噪声化,应用一个线性变化N来取消掉相关性,同时规约化信号:(NY)TNY= I. 令Z = NY。当然,白噪声化变换并不是唯一的,其条件为:WTW = I → (WZ)T(WZ) = ZT(WTW)Z = ZTZ = I,主成分是白噪声信号的一个资源。
然后,解决高阶的依赖。找到一个旋转W使白噪声信号独立,也就是WZ的列相互独立。优化问题是![]() ,其中dep(M)衡量M的列的依赖性,当然WTW = I。
,其中dep(M)衡量M的列的依赖性,当然WTW = I。
1. 非线性的去相关
通过白噪声化已经去相关:E[u v] = E[u] E[v],所以E[g(u) h(v)] = E[g(u)] E[h(v)],这些函数的性能取决于数据分布的迹的形状。dep(M)是E[ĝ ĥ]和E[ĝ] E[ĥ]的差。
2. 非高斯性
Y = AS,其中S的列是独立的,但是根据中心极限定理,他们加起来会表现出高斯性,而不混合的信号高斯性很低。
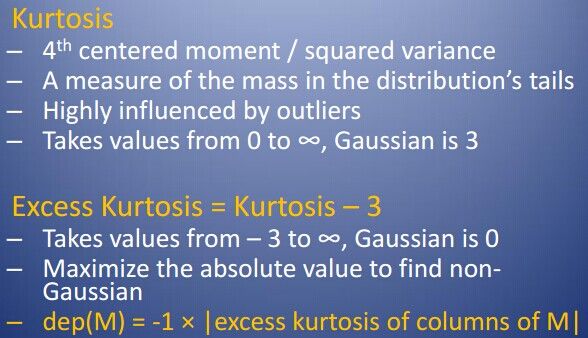
3. 非高斯性的衡量:峰态(Kurtosis)
当然还有以极大似然角度解读ICA算法的:
1. Y = As B = A-1
![]()
2. 寻找B最大化Y的似然性
3. 首先要有一个P的分布函数,通常使用sigmoid函数
