OpenCV-Python之图像直方图的绘制
- 图像直方图的两个基本属性:range[0, 256]和bins(组块)
- 直方图无空间信息
- 中间灰度级像素多,动态范围小,图像对比度低
- 直方图均匀分布时图像最清晰
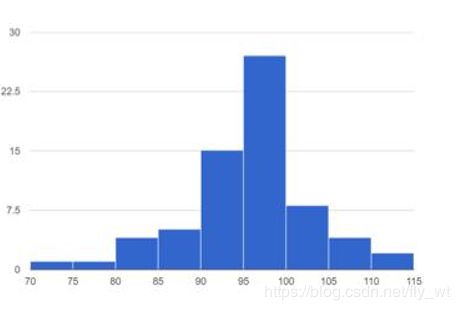
图像的直方图是用来表现图像中亮度分布的直方图,给出的是图像中某个亮度或者某个范围亮度下共有几个像素,即统计一幅图某个亮度像素数量。
b i n s i z e = 图 像 中 不 同 像 素 值 的 个 数 b i n 的 数 目 bin_{size}=\frac{图像中不同像素值的个数}{bin的数目} binsize=bin的数目图像中不同像素值的个数
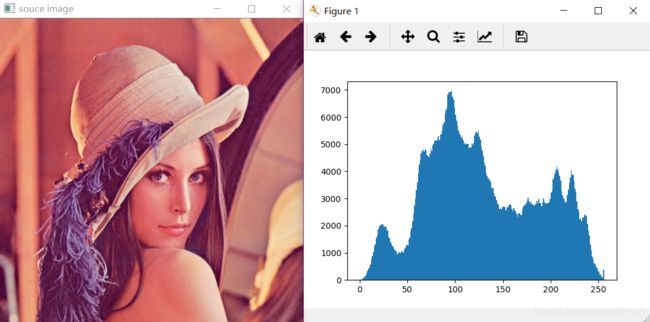
方法一:利用matplotlib
import numpy as np
import cv2 as cv
from matplotlib import pyplot as plt

def histogram_demo(image):
    plt.hist(image.ravel(), 256, [0, 256])#ravel函数功能是将多维数组降为一维数组
    plt.show()

image = cv.imread('./data/lena.jpg', 1)
cv.imshow('souce image', image)
histogram_demo(image)
cv.waitKey(0)
cv.destroyAllWindows()
注意:
- numpy的ravel函数功能是将多维数组降为一维数组
- hist函数原型:
hist(x, bins=None, range=None, density=None, weights=None, cumulative=False, bottom=None, histtype='bar', align='mid', orientation='vertical', rwidth=None, log=False, color=None, label=None, stacked=False, normed=None, hold=None, data=None, **kwargs)
x参数表示是一个数组或一个序列,是指定每个bin(箱子)分布的数据
bins参数表示指定bin(箱子)的个数,也就是总共有几条条状图
range参数表示箱子的下限和上限。即横坐标显示的范围,范围之外的将被舍弃。
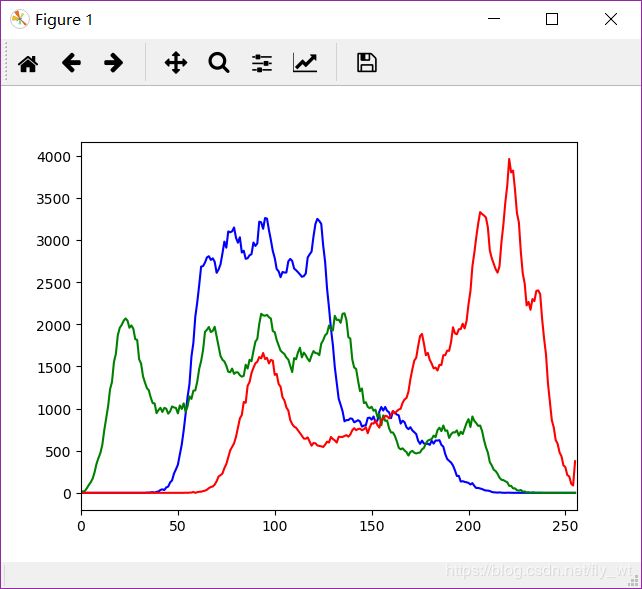
方法二: 利用OpenCV的API
def image_hist(image): #画三通道图像的直方图
   color = ("blue", "green", "red")#画笔颜色的值可以为大写或小写或只写首字母或大小写混合
   for i, color in enumerate(color):
       hist = cv.calcHist([image], [i], None, [256], [0, 256])
       plt.plot(hist, color=color)
       plt.xlim([0, 256])
   plt.show()

image = cv.imread('./data/lena.jpg', 1)
cv.imshow('souce image', image)
image_hist(image)
cv.waitKey(0)
cv.destroyAllWindows()
注意:
4. enumerate() 函数用于将一个可遍历的数据对象(如列表、元组或字符串)组合为一个索引序列,同时列出数据下标和数据,一般用在 for 循环当中。
5. cv2.calcHist的原型为:
calcHist(images, channels, mask, histSize, ranges[, hist[, accumulate]])
- images参数表示输入图像,传入时应该用中括号[ ]括起来
- channels参数表示传入图像的通道,如果是灰度图像,那就不用说了,只有一个通道,值为0,如果是彩色图像(有3个通道),那么值为0,1,2,中选择一个,对应着BGR各个通道。这个值也得用[ ]传入。
- mask参数表示掩膜图像。如果统计整幅图,那么为None。主要是如果要统计部分图的直方图,就得构造相应的掩膜来计算。
- histSize参数表示灰度级的个数,需要中括号,比如[256]
- ranges参数表示像素值的范围,通常[0,256]。此外,假如channels为[0,1],ranges为[0,256,0,180],则代表0通道范围是0-256,1通道范围0-180。
- hist参数表示计算出来的直方图。