分形程序高级技巧入门教程--第九到十二章
分形程序高级技巧入门教程--第九到十二章
[email protected]
摘要:
本系列文章是写给分形编程爱好者的一个入门教程;文章章节包括(规划中的,可能增删):
一.复数迭代的mandelbrot集合; 二.颜色平滑的简单周期算法; 三.迭代逃逸次数插值的颜色平滑;
四.使用sin函数做颜色平滑; 五.一个更有效的迭代逃逸次数插值公式; 六.使用误差扩散来杜绝色差感;
七.集合内部的颜色; 八.julia集合; 九.迭代生成的复数值的插值;
十.迭代生成的复数值的高阶插值; 十一.图形的放大和旋转; 十二.复数初始值的变换;
十三.固定颜色表; 十四.设计图案的映射; 十五.纹理映射; 十六.并行计算;
十七.更多的迭代方程和颜色方案; 十八.高次mandelbrot集合; 十九.其他分形的介绍、分形动画
正文:
(9-12章完整项目源代码: http://cid-10fa89dec380323f.office.live.com/self.aspx/.Public/hssFractal9%5E_12.zip )
(我的其他分形相关文章: http://blog.csdn.net/housisong/category/382024.aspx )
九.迭代生成的复数值的插值
迭代逃逸时的复数值也可以作为颜色函数的参数,比如:
inline double mandelbrot9(double* xList,double* yList,const long max_iter,long& out_i){ const static double M=256; const static double lnln_M=loglog(M); const double& x0=xList[0]; const double& y0=yList[0]; double x_bck=0; double y_bck=0; double x=x0; double y=y0; long i=0; for (;i
其中,把"迭代值"的距离值带入了颜色函数中,产生的图片如下:
(当然x和y值也可以作为颜色参数,甚至于整个迭代过程中产生的值都是不错的颜色参数!)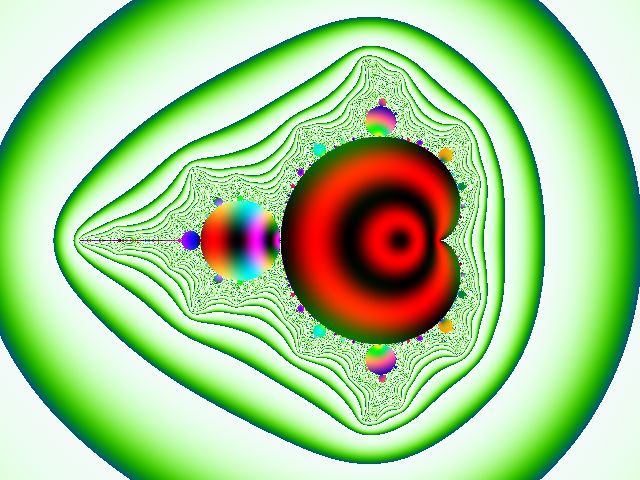
由于迭代次数的不同,造成生成的颜色产生了较强的阶梯;要去掉该阶梯我们可以进行一个简单的插值,
前面对迭代逃逸次数进行了插值(结果为iter),那么正好就可以用该值来对迭代值进行线性插值!
插值系数: s=iter-(long)iter; //得到0--1之间的一个值,用来表示两次迭代值之间的权重
插值方程: sx=x(i)*s+x(i-1)*(1-s);
sy=y(i)*s+y(i-1)*(1-s);
这样得到的结果就是连续的了,代码如下:
inline double smoothXY9(double iter,long i,const double* datas){ const double s=iter+5-(long)(iter+5); //用5避免iter可能为负的情况 return datas[i]*s+datas[i-1]*(1-s); //线性关系插值 //return pow(abs(datas[i]),s)*pow(abs(datas[i-1]),(1-s)); //指数关系插值 } inline Color32 coloring9(const double iter,long i,const long max_iter,double* xList,double* yList,const Colorf& errorColorIn,Colorf& errorColorOut){ Colorf color=errorColorIn; if (iter==max_iter){ const double x=xList[max_iter]; const double y=yList[max_iter]; double z=sqrt(x*x+y*y); double zd=z-sqrt(xList[max_iter-1]*xList[max_iter-1]+yList[max_iter-1]*yList[max_iter-1]); color.addColor(Colorf(sinColorf(z*2000),sinColorf(y*x*1000),sinColorf(zd*1000))); }else{ const double x=smoothXY9(iter,i,xList); const double y=smoothXY9(iter,i,yList); double z=sqrt(x*x+y*y); color.addColor(Colorf(sinColorf(z*20/3-236),sinColorf(z*15/3+221),sinColorf(z*30/3-254))); } Color32 resultColor=color.toColor32(); errorColorOut=color; errorColorOut.subColor(resultColor); return resultColor; } void draw_mandelbrot9(const TPixels32Ref& dst,const TViewRect& rect,const long max_iter){ std::vector
生成的图片如下: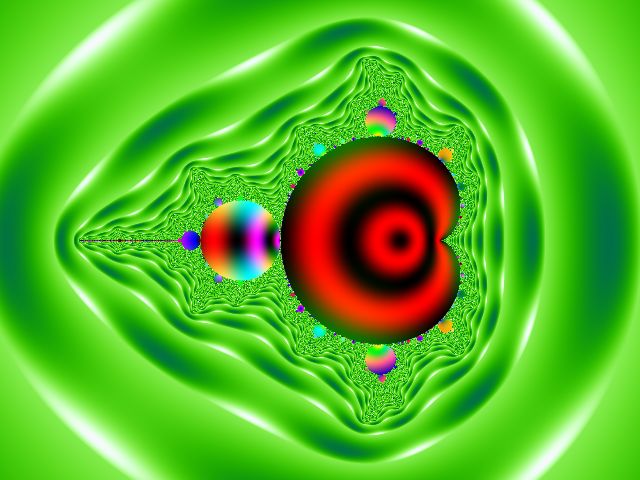
十.迭代生成的复数值的高阶插值
前面得到的颜色结果虽然连续,但看起来还是不够平滑;这是因为两次迭代值之间的关系可能并不是线性的关系;
我们可能很难去推导出迭代值的实际关系,但我们可以用通用的高次插值曲线来近似的拟合它,
比如我们使用常用的3次卷积来试试:
插值系数: s=iter-(long)iter;
插值方程: sx=x(i)*SinXDivX(2-s)+x(i-1)*SinXDivX(1-s)+x(i-2)*SinXDivX(s)+x(i-3)*SinXDivX(1+s);
sy=y(i)*SinXDivX(2-s)+y(i-1)*SinXDivX(1-s)+y(i-2)*SinXDivX(s)+y(i-3)*SinXDivX(1+s);
其中SinXDivX为:
(a+2)*x^3 - (a+3)*x^2 +1 (0<=x<1)
h(x)= a*x^3 - 5*a*x^2 + 8*a*x - 4*a (1<=x<2)
0 (2<=x)
(其中a一般取-0.5..-1)
代码如下:
inline double SinXDivX(double x) { if (x<0) x=-x; //x=abs(x); double x2=x*x; double x3=x2*x; //该函数计算插值曲线sin(x*PI)/(x*PI)的值 //PI=3.1415926535897932385; //下面是它的近似拟合表达式 ///////////////////////////////////////////////////// //一元立方插值的插值核(一元三次的方程) // (a+2)*x^3 - (a+3)*x^2 +1 (0<=x<1) // h(x)= a*x^3 - 5*a*x^2 + 8*a*x - 4*a (1<=x<2) // 0 (2<=x) const float a = -0.5; //a可以取各种值效果都可以试试 if (x<=1) return (a+2)*x3 - (a+3)*x2 + 1; else if (x<=2) return a*x3 - (5*a)*x2 + (8*a)*x - (4*a); else return 0; } inline double smoothXY10(double iter,long i,const double* datas){ const double s=iter+5-(long)(iter+5); return datas[i]*SinXDivX(2-s)+datas[i-1]*SinXDivX(1-s)+datas[i-2]*SinXDivX(s)+datas[i-3]*SinXDivX(1+s); } inline Color32 coloring10(const double iter,long i,const long max_iter,double* xList,double* yList,const Colorf& errorColorIn,Colorf& errorColorOut){ Colorf color=errorColorIn; if (iter==max_iter){ const double x=xList[max_iter]; const double y=yList[max_iter]; double z=sqrt(x*x+y*y); double zd=z-sqrt(xList[max_iter-1]*xList[max_iter-1]+yList[max_iter-1]*yList[max_iter-1]); color.addColor(Colorf(sinColorf(z*2000),sinColorf(y*x*1000),sinColorf(zd*1000))); }else{ const double x=smoothXY10(iter,i,xList); const double y=smoothXY10(iter,i,yList); double z=sqrt(x*x+y*y); color.addColor(Colorf(sinColorf(z*20*1.5-236),sinColorf(z*15*1.5+221),sinColorf(z*30*1.5-254))); } Color32 resultColor=color.toColor32(); errorColorOut=color; errorColorOut.subColor(resultColor); return resultColor; } void draw_mandelbrot10(const TPixels32Ref& dst,const TViewRect& rect,const long max_iter){ const long safe_border=4; std::vector
生成的图片如下: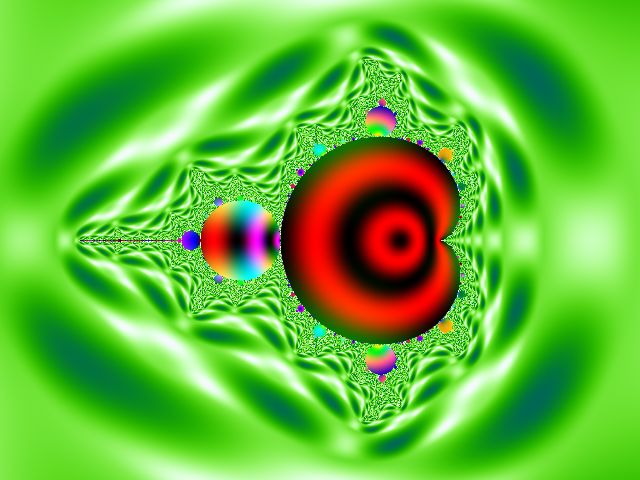
(可以试试卷积核中取不同a的效果)
在数据插值中,B样条插值(B-Spline)也是一个非常常用的插值算法,B样条插值的插值核:
x^3/2 - x^2 + 2/3 (0<=x<1)
h(x) = (2-x)^3/6 (1<=x<2)
0 (2<=x)
代码如下:
inline double BSpline(double x){ if (x<0) x=-x; //x=abs(x); double x2=x*x; double x3=x2*x; //B样条插值的插值核 // x^3/2 - x^2 + 2/3 (0<=x<1) //h(x) = (2-x)^3/6 ==(8-12x+6x^2-x^3)/6 (1<=x<2) // 0 (2<=x) if (x<1) return x3*0.5 - x2 + (2.0/3.0); else if (x<2) return (1.0/6.0)*(-x3+6*x2-12*x+8); else return 0; } inline double smoothMap(double x){ return x; //return log(abs(x)+1e-100); //return sqrt(abs(x)); //return pow(abs(x),1.15); } inline double smoothXY10B(double iter,long i,const double* datas){ const double s=(iter+5-(long)(iter+5)); return smoothMap(datas[i ])*BSpline(2-s) +smoothMap(datas[i-1])*BSpline(1-s) +smoothMap(datas[i-2])*BSpline(s) +smoothMap(datas[i-3])*BSpline(1+s); } inline Color32 coloring10B(const double iter,long i,const long max_iter,double* xList,double* yList,const Colorf& errorColorIn,Colorf& errorColorOut){ Colorf color=errorColorIn; if (iter==max_iter){ const double x=xList[max_iter]; const double y=yList[max_iter]; double z=sqrt(x*x+y*y); double zd=z-sqrt(xList[max_iter-1]*xList[max_iter-1]+yList[max_iter-1]*yList[max_iter-1]); color.addColor(Colorf(sinColorf(z*2000),sinColorf(y*x*1000),sinColorf(zd*1000))); }else{ const double x=smoothXY10B(iter,i,xList); const double y=smoothXY10B(iter,i,yList); double z=sqrt(x*x+y*y); color.addColor(Colorf(sinColorf(z*20*2-236),sinColorf(z*15*2+221),sinColorf(z*30*2-254))); } Color32 resultColor=color.toColor32(); errorColorOut=color; errorColorOut.subColor(resultColor); return resultColor; } void draw_mandelbrot10B(const TPixels32Ref& dst,const TViewRect& rect,const long max_iter){ const long safe_border=4; std::vector
生成的图片如下: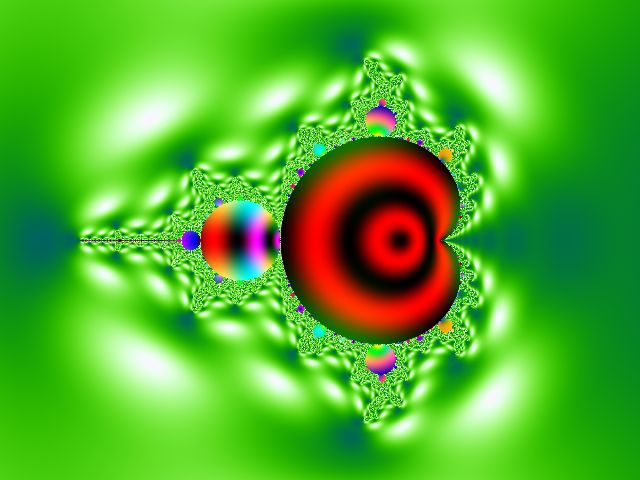
(这里的插值结果看起来比3次卷积的效果好些)
我把颜色函数稍微修改了一下,代码如下:
inline Color32 coloring10B1(const double iter,long i,const long max_iter,double* xList,double* yList,const Colorf& errorColorIn,Colorf& errorColorOut){ Colorf color=errorColorIn; if (iter==max_iter){ const double x=xList[max_iter]; const double y=yList[max_iter]; double z=sqrt(x*x+y*y); color.addColor(Colorf(sinColorf(z*20*50-236),sinColorf(z*15*50+221),sinColorf(z*30*50-254))); }else{ const double x=smoothXY10B(iter,i,xList); const double y=smoothXY10B(iter,i,yList); double z=sqrt(x*x+y*y); color.addColor(Colorf(sinColorf(x*20*2-236),sinColorf(y*15*2+221),sinColorf((x*y/sqrt(z))*30*2-254))); } Color32 resultColor=color.toColor32(); errorColorOut=color; errorColorOut.subColor(resultColor); return resultColor; } void draw_mandelbrot10B1(const TPixels32Ref& dst,const TViewRect& rect,const long max_iter){ const long safe_border=4; std::vector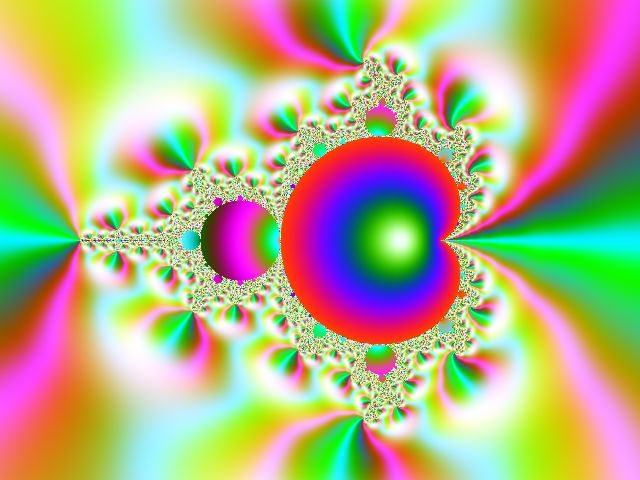
重点:迭代过程中生成的数据都可以作为颜色函数的参数(color=f(iter,i,x[],y[],等);)!
更广义的迭代值插值函数为:
z=g(s,t(z[k]),t(z[k-1]),...,t(z[k-(N-1)]));
这里g代表插值核,s代表插值系数,t代表变换函数,z代表迭代值数组,k代表起始数组坐标(比如k=i-1),
N代表使用迭代值的个数;
请试试,不同的k和各种t函数的效果!
十一.图形的放大和旋转
我们前面定义的TViewRect{ double x0,y0,r};结构已经能很好的支持缩放了,调节r的大小
就是放大或缩小,x0和y0代表的是缩放的中心点; 要支持旋转,我们增加一个成员,
角度seta(单位为度):
struct TViewRect{ double x0,y0,r,seta; };
坐标点(x,y)的旋转方程为:
rsin=sin(viewRect.seta*(PI/180));
rcos=cos(viewRect.seta*(PI/180));
new_x= (x-viewRect.x0)*rcos + (y-viewRect.y0)*rsin + viewRect.x0;
new_y=-(x-viewRect.x0)*rsin + (y-viewRect.y0)*rcos + viewRect.y0;
复数初始值在迭代前经过该旋转变换,就达到了旋转图片的目的,代码如下:
const double PI=3.14159265358979; void rotaryMap(const TViewRect& rect,double x0,double y0,double& out_x,double& out_y){ const double rsin=sin(rect.seta*(PI/180)); const double rcos=cos(rect.seta*(PI/180)); double x= (x0-rect.x0)*rcos + (y0-rect.y0)*rsin + rect.x0; double y=-(x0-rect.x0)*rsin + (y0-rect.y0)*rcos + rect.y0; out_x=x; out_y=y; } void draw_mandelbrot11(const TPixels32Ref& dst,const TViewRect& rect,const long max_iter){ const long safe_border=4; std::vector
测试缩放和旋转的代码如下:
TViewRect newRect; newRect.x0=-1.9414077; newRect.y0=0; newRect.r=0.0025; newRect.seta=0; draw_mandelbrot11(dst,newRect,max_iter);
TViewRect newRect; newRect.x0=-1.9414077; newRect.y0=0; newRect.r=0.0025; newRect.seta=45; draw_mandelbrot11(dst,newRect,max_iter);
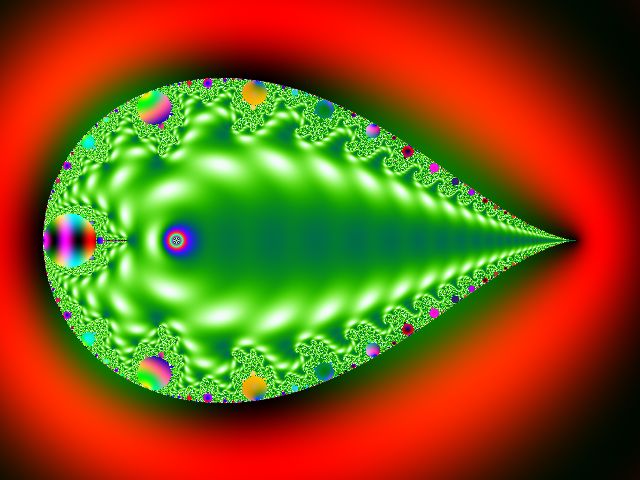
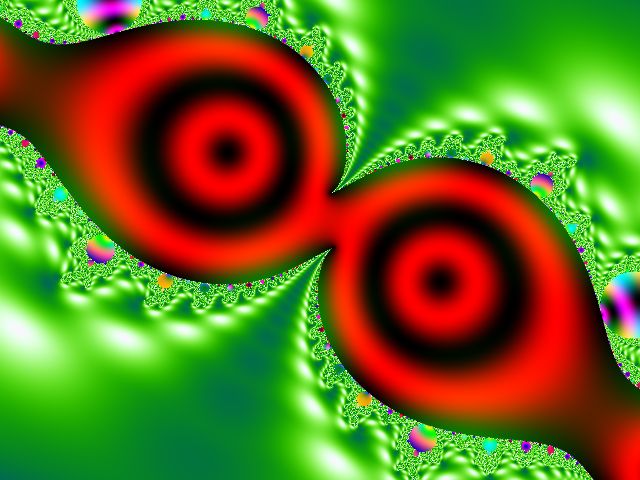
生成的图片如下: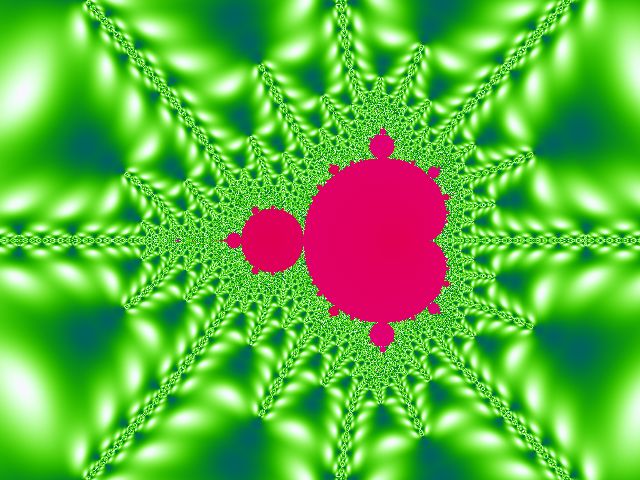
(放大M集的一个小区域)
(旋转45度)
十二.复数初始值的变换
复数初始值在迭代前可以经过旋转变换,当然也可以在该阶段经过更多的变换函数,
比如tan变换:
void tanMap(const TViewRect& rect,double x0,double y0,double& out_x,double& out_y){ double x=tan(x0*2); double y=tan(y0*2); out_x=x; out_y=y; } void draw_mandelbrot12t1(const TPixels32Ref& dst,const TViewRect& rect,const long max_iter){ const long safe_border=4; std::vector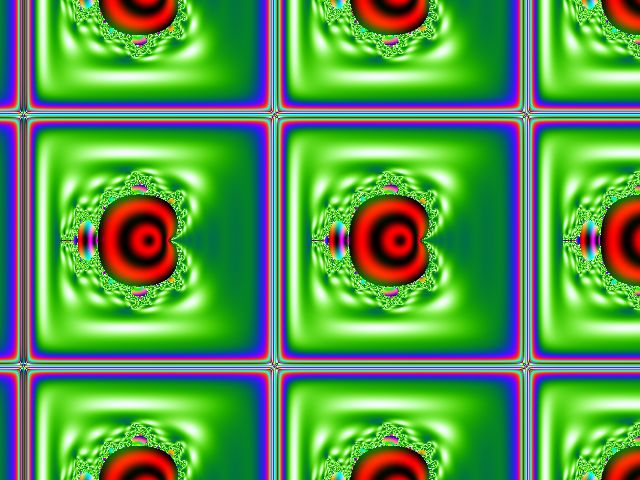
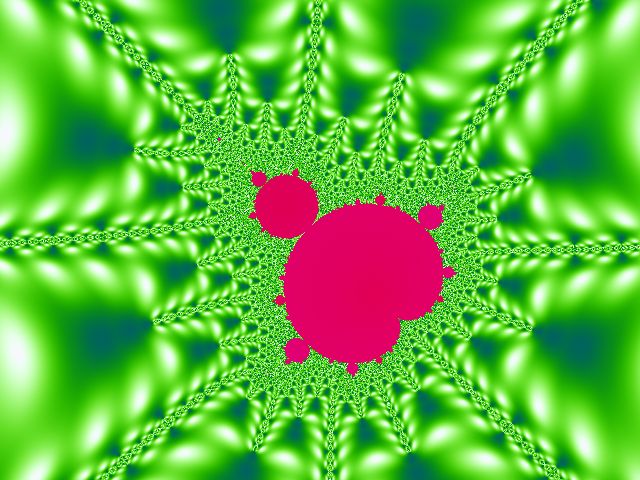
复数倒数作为变换函数会怎样呢?
void divMap2(const TViewRect& rect,double x0,double y0,double& out_x,double& out_y){ //C=1/C; x0=(x0+1.4)*1.6; y0=y0*1.6; const double z=(x0*x0+y0*y0+1e-100); double x=x0/z; double y=-y0/z; out_x=x; out_y=y; } void draw_mandelbrot12t2(const TPixels32Ref& dst,const TViewRect& rect,const long max_iter){ const long safe_border=4; std::vector
(1/C面)
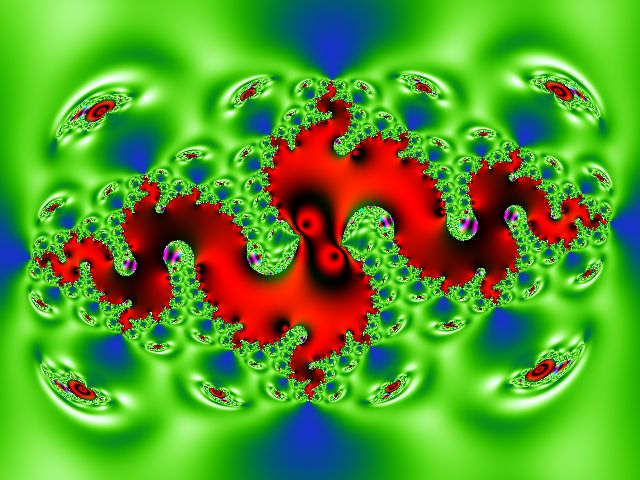
我们甚至也可以把其他分形算法合并进来,比如用julia迭代作为变换函数:
inline double julia12(double* xList,double* yList,const long max_iter,double jx0,double jy0,long& out_i){ const static double M=256; const static double lnln_M=loglog(M); const double& x0=xList[0]; const double& y0=yList[0]; double x_bck=0; double y_bck=0; double x=x0; double y=y0; long i=0; for (;i
TViewRect newRect; newRect.x0=0; newRect.y0=0; newRect.r=1.5; newRect.seta=120; draw_mandelbrot12j(dst,newRect,max_iter,3,0.28888,0.012325);
TViewRect newRect; newRect.x0=0; newRect.y0=0; newRect.r=1.7; newRect.seta=0; draw_mandelbrot12j(dst,newRect,max_iter,16,-0.81442,0.19633);
