文章作者:Tyan
博客:noahsnail.com | CSDN |
本文主要是关于PyTorch的一些用法。
import torch
import matplotlib.pyplot as plt
from torch.autograd import Variable


# 生成数据
x = torch.unsqueeze(torch.linspace(-1, 1, 100), dim = 1)
y = x.pow(2) + 0.2 * torch.rand(x.size())

# 变为Variable
x, y = Variable(x), Variable(y)

# 定义网络
net = torch.nn.Sequential(
    torch.nn.Linear(1, 10),
    torch.nn.ReLU(),
    torch.nn.Linear(10, 1)
)

print net
Sequential (
  (0): Linear (1 -> 10)
  (1): ReLU ()
  (2): Linear (10 -> 1)
)
# 选择优化方法
optimizer = torch.optim.SGD(net.parameters(), lr = 0.5)

# 选择损失函数
loss_func = torch.nn.MSELoss()

# 训练网络
for i in xrange(1000):
    # 对x进行预测
    prediction = net(x)
    # 计算损失
    loss = loss_func(prediction, y)
    # 每次迭代清空上一次的梯度
    optimizer.zero_grad()
    # 反向传播
    loss.backward()
    # 更新梯度
    optimizer.step()

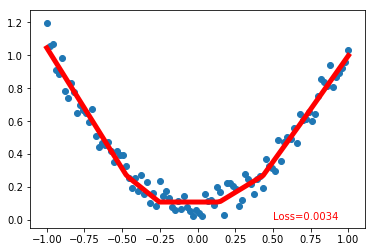
plt.scatter(x.data.numpy(), y.data.numpy())
plt.plot(x.data.numpy(), prediction.data.numpy(), 'r-', lw = 5)
plt.text(0.5, 0, 'Loss=%.4f' % loss.data[0], fontdict={'size': 10, 'color':  'red'})
plt.show()
# 保存训练的模型

# 保存整个网络和参数
torch.save(net, 'net.pkl')

# 重新加载模型
net = torch.load('net.pkl')

# 用新加载的模型进行预测
prediction = net(x)
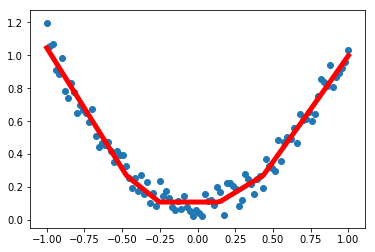
plt.scatter(x.data.numpy(), y.data.numpy())
plt.plot(x.data.numpy(), prediction.data.numpy(), 'r-', lw = 5)
plt.show()
# 只保存网络的参数, 官方推荐的方式
torch.save(net.state_dict(), 'net_params.pkl')

# 定义网络
net = torch.nn.Sequential(
    torch.nn.Linear(1, 10),
    torch.nn.ReLU(),
    torch.nn.Linear(10, 1)
)

# 加载网络参数
net.load_state_dict(torch.load('net_params.pkl'))

# 用新加载的参数进行预测
prediction = net(x)
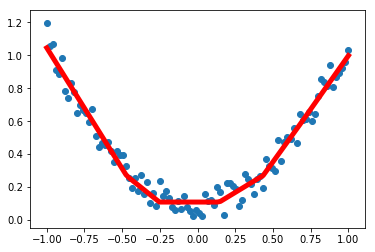
plt.scatter(x.data.numpy(), y.data.numpy())
plt.plot(x.data.numpy(), prediction.data.numpy(), 'r-', lw = 5)
plt.show()
参考资料
- https://www.youtube.com/user/MorvanZhou


