关于echarts柱状图颜色渐变设置
我做的这个需求是两个Y轴显示,对柱状颜色的设置在series 的 itemStyle 里面,
itemStyle: {
                    normal: {
                        color: new echarts.graphic.LinearGradient(0, 0, 0, 1, [{
                            offset: 0,
                            color: '#ba7ef3'
                        }, {
                            offset: 1,
                            color: '#965df2'
                        }]),
                    }
                },
先上效果图:
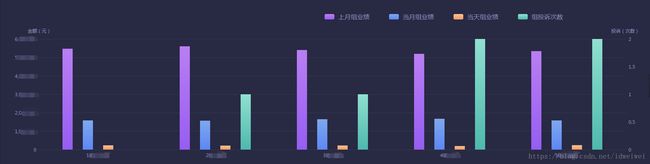
直接上实例代码看看咯:
var myChart = echarts.init(document.getElementById('echarts'));
// 显示标题,图例和空的坐标轴
    myChart.showLoading();    //数据加载完之前先显示一段简单的loading动画
    myChart.setOption({
        title: {
            text: ''
        },
        tooltip: {
            trigger: 'axis'
        },
        legend: {
            x: 'right',
            data: ['上月组业绩', '当月组业绩', '当天组业绩', '组投诉次数'],
            textStyle: {
                color: '#9191c2',
                fontSize: 16,
                padding: [0, 40, 0, 5],
            },
            padding: [35, 200, 0, 0],
        },
        toolbox: {
            show: false,
            feature: {
                mark: {show: false},
                dataView: {show: true, readOnly: false},
                magicType: {show: true, type: ['line', 'bar']},
                restore: {show: true},
                saveAsImage: {show: true}
            }
        },
        grid: {
            y: 100, y2: 20, x: 100, x2: 80,
            tooltip: {
                show: true
            }
        },
        calculable: true,
        yAxis: [
            {
                name: '金额(元)',
                nameTextStyle: {
                    color: '#9191c2'
                },
                splitLine: {
                    show: true,//去除网格线
                    lineStyle: {
                        color: '#383756'
                    },
                },
                type: 'value',
                axisLabel: {
                    show: true,
                    interval: 0,
                    textStyle: {
                        color: '#9191c2'
                    }
                },
                axisTick: {
                    show: true
                },
                axisLine: {show: false},
                /* min: 0,
                 max: 800000,
                 type: 'value',
                 axisLabel: {
                     show: true,
                     formatter: '{value}'
                 }*/
            },

            {
                name: '投诉(次数)',
                nameTextStyle: {
                    color: '#9191c2'
                },
                splitLine: {show: false},//去除网格线
                type: 'value',
                axisLabel: {
                    show: true,
                    interval: 0,
                    textStyle: {
                        color: '#9191c2'
                    }
                },
                axisTick: {
                    show: false
                },
                axisLine: {show: false}
                /*type: 'value',
                min: 0,
                max: 800,
                axisLabel: {
                    show: true,
                    formatter: '{value}'
                }*/
            },
        ],
        xAxis: {
            axisLabel: {
                interval: 0,
                textStyle: {
                    color: '#9191c2'
                },
                show: true
            },
            axisTick: {
                show: false
            },
            axisLine: {
                lineStyle: {
                    color: '#383756'
                },
                show: false
            },
            data: ['1组', '2组', '3组', '4组', '5组',],
        },
        series: [
            {
                name: '上月组业绩',
                type: 'bar',
                barWidth: 26,
                smooth: true,
                itemStyle: {
                    normal: {
                        color: new echarts.graphic.LinearGradient(0, 0, 0, 1, [{
                            offset: 0,
                            color: '#ba7ef3'
                        }, {
                            offset: 1,
                            color: '#965df2'
                        }]),
                    }
                },
                symbol: 'emptydiamond',
                data: lastMonthArray,
                barGap: '100%'
            },
            {
                name: '当月组业绩',
                type: 'bar',
                barWidth: 26,
                smooth: true,
                itemStyle: {
                    normal: {
                        color: new echarts.graphic.LinearGradient(0, 0, 0, 1, [{
                            offset: 0,
                            color: '#7ea8ee'
                        }, {
                            offset: 1,
                            color: '#5d87f4'
                        }]),
                    }
                },
                symbol: 'emptydiamond',
                data: currentMonthArray,
                barGap: '100%'
            },
            {
                name: '当天组业绩',
                type: 'bar',
                barWidth: 26,
                itemStyle: {
                    normal: {
                        color: new echarts.graphic.LinearGradient(0, 0, 0, 1, [{
                            offset: 0,
                            color: '#f9c392'
                        }, {
                            offset: 1,
                            color: '#f09b67'
                        }]),
                    }
                },
                symbol: 'emptydiamond',
                data: currentDayArray,
                barGap: '100%'
            },
            {
                name: '组投诉次数',
                smooth: true,
                barWidth: 26,
                type: 'bar',
                itemStyle: {
                    normal: {
                        color: new echarts.graphic.LinearGradient(0, 0, 0, 1, [{
                            offset: 0,
                            color: '#90e0d0'
                        }, {
                            offset: 1,
                            color: '#4eb9ad'
                        }]),
                    }
                },
                yAxisIndex: 1,
                symbol: 'emptydiamond',
                data: ComplaintArray,
                barGap: '100%'
            },

        ]

    });
    myChart.hideLoading(); //隐藏加载动画
是不是很舒坦呀 后续更新关于echarts的更多设置哦