TensorFlow的学习之路--搭建简单的线性回归模型
在学习之前,需要明白几个函数的具体意义:
tf.placeholder:不提供初始值,通过Session.run的函数feed_dict参数指定,可作为一个占位符,如:
x=tf.placeholder(shape=[None,1],dtype=tf.float32,name='x')
y=tf.placeholder(shape=[None,1],dtype=tf.float32,name='y')
tf.constant:定义一个常量,如:
a=tf.constant(4.0,dtype=tf.float32)
tf.variable:申明时,需要提供初始值,比如模型的权重,偏置之类的,如:
Weights=tf.Variable(tf.random_normal([in_size,out_size]))
biass=tf.Variable(tf.zeros([1,out_size])+0.1)
随后练习搭建一个线性回归模型:
首先我们自己定义一条直线,如:y=2*x+5
def liner(x):
    return y=2*x+5
line_space=np.linspace(-5,5,1000)
plt.plot(line_space,liner(line_space))
plt.grid()
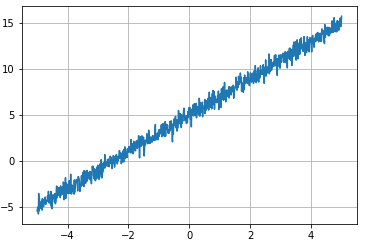
再对定义的直线加上噪声
def liner_with_n(x)
    return[liner(t)+np.random.normal(0,0.5)for t in x]
plt.plot(line_space,liner_with_n(line_space))
plt.grid()
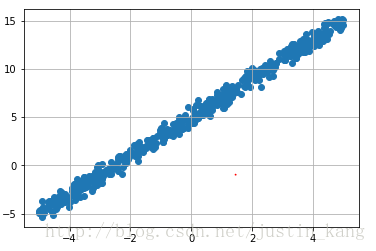
然后随机取样500个点,其中前400个点作为训练点,后面100个点作为测试点
sample_x=np.random.choice(line_space,size=500)
sample_y=liner_with_n(sample_x)
plt.scatter(sample_x,sample_y)
plt.grid()
whole=np.transpose(np.array([sample_x,sample_y]))
training_set=whole[:-100]
test_set=whole[-100:]
现在500个数据量较小,可以一次性全部训练,但数据量大了,需要分布进行,所以再定义一个mini_batch
def mini_batch(data):
   for i in range(len(data)//50):
        pos=50*i
        yield data[pos:pos+50]
现在就开始定义计算图了
graph=tf.Graph()
with graph.as_default():
   x=tf.placeholder(shape=[None,1],dtype=tf.float32,name='x')
y=tf.placeholder(shape=[None,1],dtype=tf.float32,name='y')
##定义变量,首先定义a,b为0的浮点型
a=tf.Variable(0.)
b=tf.Variable(0.)
##定义模型
liner_model=a*x+b
#定义损失函数
loss=tf.reduce_mean(tf.square(liner_model-y))
#使用梯度下降法训练缩小loss
opt=tf.train.GradientDescentOptimizer(0.001).minimize(loss)
##运行计算图
##初始化数据
with tf.Session(graph=graph) as sess:
init=tf.global_variables_initializer()
sess.run(init)
step=0
   for i in range(1000)
      for minibatch in mini_batch(training_set):
   _,l=sess.run([opt,loss],feed_dict={x:np.reshape(minibatch[:,0],(-1,1)),
                                        y:np.reshape(minibatch[:,1],(-1,1))})
       if step%100==0
        print(l)
print("train  finished")
##测试
res,l=sess.run([a,b],loss),feed_dict={x:np.reshape(minibatch[:,0],(-1,1)),
y:np.random.reshape(minibatch[:,1],(-1,1))}
print(l)
#测试
def liner_test(x,res):
    return x*res[0]+res[1]
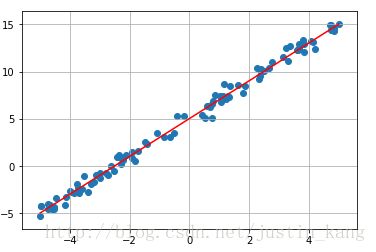
plt.plot(line_space,liner_test(line_space,res),'r-')
plt.scatter(sample_x[:100],sample_y[:100])
plt.grid()
得到的res值为1.99,5.03
与开始的y=2*x+5还是挺准的


