CatBoost的Python与R实现
作者:徐静 AI图像算法研发工程师
博客:https://dataxujing.github.io/
GitHub: https://github.com/DataXujing

CatBoost(Categorical Boosting)算法是一种类似于XGBoost,LightGBM的Gradient Boosting算法,其算法创新主要有两个:一个是对于离散特征值的处理,采用了ordered TS(target statistic)的方法;其二是提供了两种训练模式:Ordered和Plain,其具体的伪代码如下图所示:

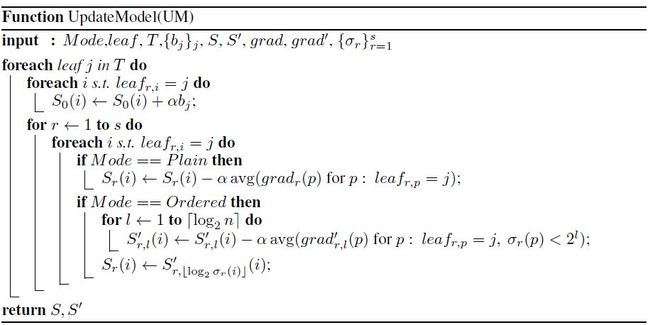

通过ordered boosting的思想解决了Gradient Boosting中常出现的prediction shift问题。
CatBoost目前支持通过Python,R和命令行进行调用和训练,支持GPU,其提供了强大的训练过程可视化功能,可以使用jupyter notebook,CatBoost Viewer,TensorBoard可视化训练过程,学习文档丰富,易于上手。
本文带大家结合kaggle中titanic公共数据集基于Python和R训练CatBoost模型。
Python实现CatBoost
1.加载数据:
```python
from catboost.datasets import titanic
import numpy as np
from sklearn.model_selection import train_test_split
from  catboost import CatBoostClassifier, Pool, cv
from sklearn.metrics import accuracy_score

train_df, test_df = titanic()

X = train_df.drop('Survived', axis=1)
y = train_df.Survived

# 数据划分
X_train, X_validation, y_train, y_validation = train_test_split(X, y, train_size=0.75, random_state=42)

X_test = test_df
```
这里我们直接使用数据框的结构,对于CatBoost支持numpy中的数组和pandas中的数据框,同时也提供了一种pool数据结构,如果有速度和内存占用优化的需求,官方建议使用pool数据结构,本文我们使用数据框结构作为例子。
2.使用hyperopt调参:
```python

import hyperopt
from numpy.random import RandomState

# 目的是最小化目标函数
def hyperopt_objective(params):
    model = CatBoostClassifier(
        l2_leaf_reg=int(params['l2_leaf_reg']),
        learning_rate=params['learning_rate'],
        iterations=500,
        eval_metric='Accuracy',
        random_seed=42,
        logging_level='Silent'
    )

    cv_data = cv(
        Pool(X, y, cat_features=categorical_features_indices),
        model.get_params()
    )
    best_accuracy = np.max(cv_data['test-Accuracy-mean'])

    return 1 - best_accuracy

# 需要优化的参数备选取值
params_space = {
    'l2_leaf_reg': hyperopt.hp.qloguniform('l2_leaf_reg', 0, 2, 1),
    'learning_rate': hyperopt.hp.uniform('learning_rate', 1e-3, 5e-1),
}

trials = hyperopt.Trials()

# 参数搜索
best = hyperopt.fmin(
    hyperopt_objective,
    space=params_space,
    algo=hyperopt.tpe.suggest,
    max_evals=50,
    trials=trials,
    rstate=RandomState(123)
)

# 打印最优的参数组合,并使用交叉验证重新训练
print(best)

```
在最优参数下做交叉验证:
```python

model = CatBoostClassifier(
    l2_leaf_reg=int(best['l2_leaf_reg']),
    learning_rate=best['learning_rate'],
    iterations=500,
    eval_metric='Accuracy',
    random_seed=42,
    logging_level='Silent'
)
cv_data = cv(Pool(X, y, cat_features=categorical_features_indices), model.get_params())

model.fit(X, y, cat_features=categorical_features_indices)
```
除此之外我们也可以采用网格搜索或随机参数搜索,下面我们提供了gridsearchCV的过程供参考:
```python

from catboost import CatBoostClassifier

def auc(m, X_train, X_test):
    return (metrics.roc_auc_score(y——train,m.predict_proba(X_train)[:,1]),
                            metrics.roc_auc_score(y_test,m.predict_proba(X_test)[:,1]))

params = {'depth': [4, 7, 10],
          'learning_rate' : [0.03, 0.1, 0.15],
         'l2_leaf_reg': [1,4,9],
         'iterations': [300]}
cb = CatBoostClassifier()
model = GridSearchCV(cb, params, scoring="roc_auc", cv = 3)
model.fit(X_train,y_train,cat_features=categorical_features_indices)
```
训练过程中会有很多有意思的参数可供调整,主要是针对于训练速度和精度的参数,除此之外还有一些可视化和和GPU相关的参数,详细的可参考CatBoost的官方文档。
3.变量重要性与预测:
```python
# 打印变量重要性
feature_importances = model.get_feature_importance(X_train)
feature_names = X_train.columns
for score, name in sorted(zip(feature_importances, feature_names), reverse=True):
    print('{}: {}'.format(name, score))

# 预测
# 3种模式的预测结果展示
print(model.predict_proba(data=X_validation))
print(model.predict(data=X_validation))
raw_pred = model.predict(data=X_validation, prediction_type='RawFormulaVal')
print(raw_pred)

import math
def sigmoid(x):
  return 1 / (1 + math.exp(-x))
probabilities = [sigmoid(x) for x in raw_pred]
print(np.array(probabilities))

```
4.模型持久化:
```python
# 模型保存(后缀名可以换成其他)
model.save_model('catboost_model.bin')

# 模型加载
my_best_model.load_model('catboost_model.bin')
print(my_best_model.get_params())
print my_best_model.random_seed_
print my_best_model.learning_rate_

```
R语言实现CatBoost
1.构建Pool数据
A.从文件中读取:
```R
library(catboost)
library(caret)
library(titanic)

pool_path <- system.file("extdata","adult_train.1000",package="catboost")
column_description_path <- system.file("extdata","adult.cd",package="catboost")
pool <- catboost.load_pool(pool_path,column_description=column_description_path)

head(pool,1)

```
主要有两个文件,一个是具体的特征值文件pool_path,一个是列的描述文件column_description_path,主要描述了列的属性,目前主要包括三种:
Target (label);Categ;Num(default type),并且要注意这里的列的索引沿用了Python方式从0开始。
B.从矩阵中获取:
```R
pool_path = system.file("extdata", "adult_train.1000", package="catboost")

column_description_vector = rep('numeric', 15)
cat_features <- c(3, 5, 7, 8, 9, 10, 11, 15)
for (i in cat_features)
    column_description_vector[i] <- 'factor'

data <- read.table(pool_path, head = F, sep = "\t", colClasses = column_description_vector, na.strings='NAN')

# Transform categorical features to numeric.
for (i in cat_features)
    data[,i] <- as.numeric(factor(data[,i]))


target <- c(1)
data_matrix <- as.matrix(data)
pool <- catboost.load_pool(as.matrix(data[,-target]),
                             label = as.matrix(data[,target]),
                             cat_features = cat_features)
head(pool, 1)

```
注意矩阵中都是数值型的数据,因此,首先在进入矩阵前的数据需进行数值化,然后在构建pool数据结构时指定离散特征的列标。
C.从数据框中获取:
```R
train_path = system.file("extdata", "adult_train.1000", package="catboost")
test_path = system.file("extdata", "adult_test.1000", package="catboost")

column_description_vector = rep('numeric', 15)
cat_features <- c(3, 5, 7, 8, 9, 10, 11, 15)
for (i in cat_features)
    column_description_vector[i] <- 'factor'

train <- read.table(train_path, head = F, sep = "\t", colClasses = column_description_vector, na.strings='NAN')
test <- read.table(test_path, head = F, sep = "\t", colClasses = column_description_vector, na.strings='NAN')
target <- c(1)
train_pool <- catboost.load_pool(data=train[,-target], label = train[,target])
test_pool <- catboost.load_pool(data=test[,-target], label = test[,target])
head(train_pool, 1)
head(test_pool, 1)

```
注意离散变量需要转化为因子变量,数值型变量即为数值型变量,label也应该是数值型变量。
2.训练模型与预测
```R
fit_params <- list(iterations = 100,
                   thread_count = 10,
                   loss_function = 'Logloss',
                   ignored_features = c(4,9),
                   border_count = 32,
                   depth = 5,
                   learning_rate = 0.03,
                   l2_leaf_reg = 3.5,
                   train_dir = 'train_dir',
                   logging_level = 'Silent'
                  )
model <- catboost.train(train_pool, test_pool, fit_params)

# 更多参数可以help(catboost.train)

# accuracy方法
calc_accuracy <- function(prediction, expected) {
  labels <- ifelse(prediction > 0.5, 1, -1)
  accuracy <- sum(labels == expected) / length(labels)
  return(accuracy)
}

# 概率预测
prediction <- catboost.predict(model, test_pool, prediction_type = 'Probability')
cat("Sample predictions: ", sample(prediction, 5), "\n")

# class预测
labels <- catboost.predict(model, test_pool, prediction_type = 'Class')
table(labels, test[,target])

# works properly only for Logloss
accuracy <- calc_accuracy(prediction, test[,target])
cat("\nAccuracy: ", accuracy, "\n")

# 变量重要性计算
cat("\nFeature importances", "\n")
catboost.get_feature_importance(model, train_pool)

cat("\nTree count: ", model$tree_count, "\n")

```
3.使用caret包
A.加载数据:
```r
set.seed(12345)

data <- as.data.frame(as.matrix(titanic_train), stringsAsFactors=TRUE)

age_levels <- levels(data$Age)
most_frequent_age <- which.max(table(data$Age))
data$Age[is.na(data$Age)] <- age_levels[most_frequent_age]

drop_columns = c("PassengerId", "Survived", "Name", "Ticket", "Cabin")
x <- data[,!(names(data) %in% drop_columns)]
y <- data[,c("Survived")]
```
B.基于caret的模型训练:
```r
fit_control <- trainControl(method = "cv",
                            number = 5,
                            classProbs = TRUE)

# gridCV
grid <- expand.grid(depth = c(4, 6, 8),
                    learning_rate = 0.1,
                    iterations = 100,
                    l2_leaf_reg = 0.1,
                    rsm = 0.95,
                    border_count = 64)

# 使用catboost.caret方法
model <- train(x, as.factor(make.names(y)),
                method = catboost.caret,
                logging_level = 'Silent', preProc = NULL,
                tuneGrid = grid, trControl = fit_control)

```
C.打印模型和变量重要性:
```r

print(model)

importance <- varImp(model, scale = FALSE)
print(importance)
```
D.预测:
```r
pre_prob <- predict(model, type = 'prob')
print(pre_prob)
```
Reference
[1] https://github.com/catboost/tutorials
[2] https://github.com/catboost
[3] CatBoost: unbiased boosting with categorical features
[4] CatBoost: gradient boosting with categorical features support
[5] 谁是数据竞赛王者? CatBoost vs. Light GBM vs. XGBoost
—————————————
往期精彩:
人民日报终发文:国航“避重就轻、不作为、护犊子、体验差、听不进批评”
华为延期,三星下架,讲讲折叠屏为什么这么难
遇事不决赖毛子,美国这次打算封杀变脸APP
