R语言基础编程技巧汇编 - 11
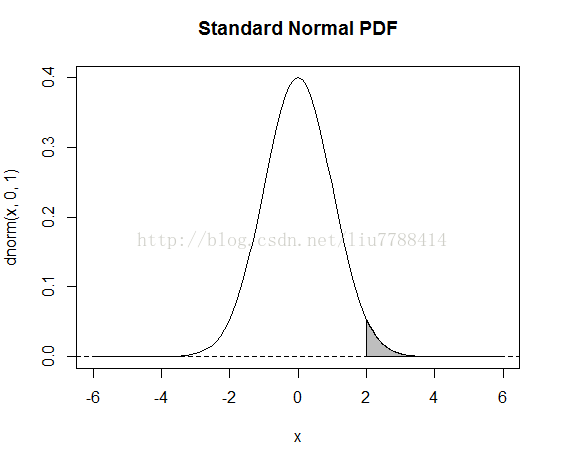
1. 绘制函数曲线与坐标轴围成的阴影
curve(dnorm(x, 0,1), xlim = c(-6, 6), main = "Standard Normal PDF")
cord.x <- c(2,seq(2, 5, 0.01), 5)
cord.y <- c(0,dnorm(seq(2, 5, 0.01)), 0)
abline(h = 0, lty= 2)
polygon(cord.x,cord.y, col = "grey")
2. list应用do.call函数示例
s<- c("-")
x<- strsplit(sub(":","-", rep(c("2:97852888-97856941"),10)), "-")
y<- do.call(rbind, x)
x;y
3. 共享x轴但不同y轴的图形绘制在一起
x <- 1:5
y1 <- rnorm(5)
y2 <- rnorm(5,20)
par(mar=c(5,4,4,5)+.1)
plot(x,y1,type="l",col="red")
par(new=TRUE)
plot(x,y2,,type="l",col="blue",xaxt="n",yaxt="n",xlab="",ylab="")
axis(4)
mtext("y2",side=4,line=3)
legend("topleft",col=c("red","blue"),lty=1,legend=c("y1","y2"))
4. try函数抓取异常
a <-try(setwd("C:\\Users\\wrongfolder"), silent = TRUE)
if ('try-error' %in% class(a))
setwd("C:\\Users\\qoiqpwqr")
5. 矩阵的秩
用qr分解来求
x1=matrix(rnorm(20),4,5);x1
qr(x1)$rank
x2=matrix(1:9,3,3,)
qr(x2)$rank
6. 打开多个绘图窗口
> dev.list()
windows windows windows
2 3 4
> dev.cur()
windows
4
> dev.set(3) #change thecurrent window to window 3
windows
3
> dev.cur() #check it
windows
3
> dev.off() #close thecurrent window and window 4 is active
windows
4
> dev.list()
windows windows
2 4
7. 返回当前行最大值的列名(不是索引)
x <- matrix(c(3.773964e-05, 2.236609e-07, 1.204275e-06,9.999608e-01,
7.805035e-07, 1.026306e-10, 1.507551e-07, 9.999991e-01,
5.553381e-06, 2.985323e-08, 1.000433e-06, 9.999934e-01,
7.893392e-07, 9.274931e-11, 1.441299e-07, 9.999991e-01,
3.000040e-04, 2.510037e-02, 2.350496e-04, 9.743646e-01),
nrow = 5,ncol = 4, byrow = TRUE)
dimnames(x) <- list(1:5, LETTERS[1:4])
apply(x, 1, function(t) colnames(x)[which.max(t)])
8. 数学表达式和数学符号绘制的示例
demo(plotmath)
9. 函数内部清除全局域中的变量
ClearAll <- function()
{
eval(quote(rm(list=ls(all=TRUE))),envir=globalenv())
}
或者,如果想保留ClearAll函数
ClearAll <- function()
{
eval(quote(rm(list=setdiff(ls(all=TRUE),"ClearAll"))), envir=globalenv())
}
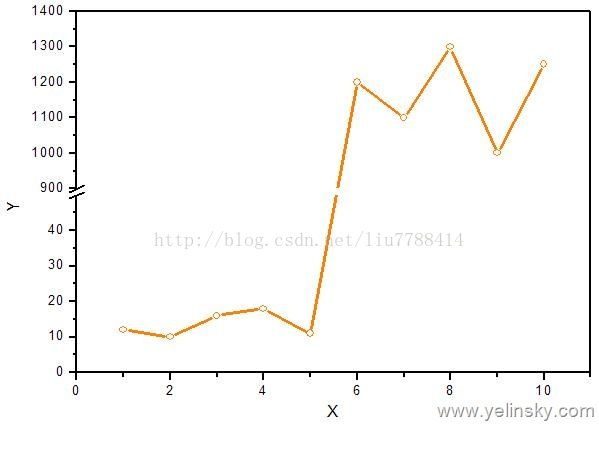
10.坐标轴打断
先安装并加载plotrix库,然后就有了 axis.break
library(plotrix)
plot(...)
axis.break(...)
11. 扩大Console输出显示行数
用R读取数据时提醒“ [reachedgetOption("max.print") -- omitted 1000 rows ]]”,修改参数“options(max.print=1000000)”后可以展示全部数据。
12. 组合数
choose(n,k)
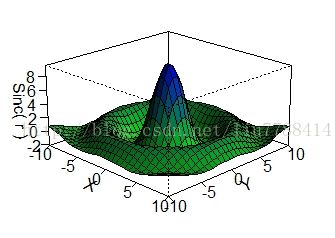
13. 三维网格图
require(grDevices)
x <- seq(-10, 10, length= 30)
y <- x
f <- function(x, y) { r <-sqrt(x^2+y^2); 10 * sin(r)/r }
z <- outer(x, y, f)
z[is.na(z)] <- 1
op <- par(bg = "white")
nrz <- nrow(z)
ncz <- ncol(z)
nbcol <- 100
jet.colors <- colorRampPalette( c("green","blue") )
color <- jet.colors(nbcol)
zfacet <- z[-1, -1] + z[-1, -ncz]+ z[-nrz, -1] + z[-nrz, -ncz]
facetcol <- cut(zfacet, nbcol)
persp(x, y, z, theta = 30, phi =30,
expand =0.5, col = color[facetcol])
persp(x, y, z, theta = 45, phi = 20,
expand =0.5, col = color[facetcol],
r=180,
ltheta =120,
shade =0.75,
ticktype ="detailed",
xlab ="X", ylab = "Y", zlab = "Sinc( r )" ,
)
14. 移除set.seed设定的随机数种子
rm(.Random.seed)
15. 矩阵的幂运算
自己写个函数用loop实现n次%*%。
或者安装个expm的package然后就可以调用%^%


