霍夫变换检测直线--原理和Matlab实现
该博客所需代码和资源文件可以到Github中进行下载。
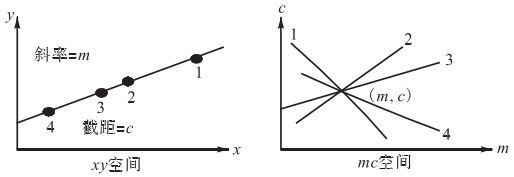
霍夫变换本质上是坐标变换,如下图1,左半部分表示直线的xy空间,直线方程为 y = m x + c y=mx+c y=mx+c,其中斜率为m,截距为c。右半部分表示将直线从xy空间变换到mc空间,取直线在xy空间上的四点1,2,3,4,在mc空间就是不同斜率和截距的四条直线。
那么,在mc空间中四条直线的交点处的m值和c值就对应xy空间中直线的m和c。同理,对图片中的直线来说,将直线中的每个点都变换到变换后空间,找出多条直线相交的点就可以找出变换前空间的直线。
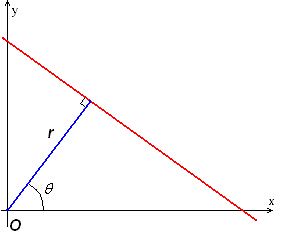
图1是为了更好理解坐标变换的概念,但是在实际应用中是将xy空间变换到极坐标系,方程为 ρ = x c o s ( θ ) + y s i n ( θ ) \rho=xcos(\theta)+ysin(\theta) ρ=xcos(θ)+ysin(θ),如下图2。
其中r,即 ρ \rho ρ为原点到直线的垂直距离, θ \theta θ为与x轴的夹角。从上述极坐标方程可以看出,将该直线变换到 ρ θ \rho\theta ρθ坐标系后将是一系列不同初相、幅度,但是周期均为 2 π 2\pi 2π的正弦曲线,所有正弦曲线交点处的 ρ 和 θ \rho和\theta ρ和θ将代表xy空间中的这条直线。
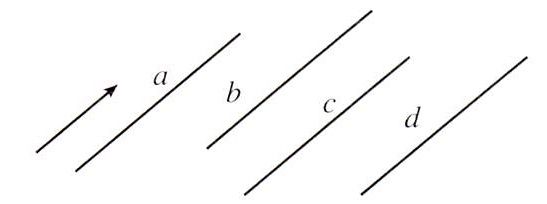
下图3为测试图像,是一张简单但是有代表性的图像。
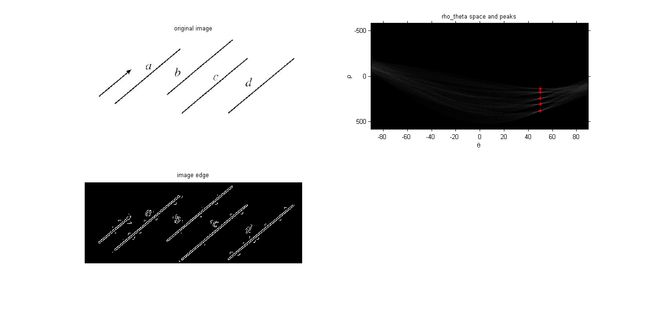
以下代码先根据canny算子找出图片的边缘,将图片边缘经过霍夫变换,变换到 ρ θ \rho\theta ρθ空间,因为图3中有5条直线,为了演示方便,取前5个交点最多处。
img  = imread('line.jpg');
subplot(221), imshow(img), title('original image');
img_gray = rgb2gray(img);
% the canny edge of image
BW = edge(img_gray,'canny');
subplot(223), imshow(BW), title('image edge');
% the theta and rho of transformed space
[H,Theta,Rho] = hough(BW);
subplot(222), imshow(H,[],'XData',Theta,'YData',Rho,'InitialMagnification','fit'),...
    title('rho\_theta space and peaks');
xlabel('\theta'), ylabel('\rho');
axis on, axis normal, hold on;
% label the top 5 intersections
P  = houghpeaks(H,5,'threshold',ceil(0.3*max(H(:))));
x = Theta(P(:,2));
y = Rho(P(:,1));
plot(x,y,'*','color','r');
边缘信息和相应的霍夫变换结果如下图4。
上述代码找到了5条直线对应的 ρ 和 θ \rho和\theta ρ和θ,通过如下代码进行反变换在原图中标记出相应的直线。
% find lines and plot them
lines = houghlines(BW,Theta,Rho,P,'FillGap',5,'MinLength',7);
figure, imshow(img), hold on
max_len = 0;
for k = 1:length(lines)
 xy = [lines(k).point1; lines(k).point2];
 plot(xy(:,1),xy(:,2),'LineWidth',2,'Color','r');
end
最终结果如下图5。
参考网址
http://www.cnblogs.com/smartvessel/archive/2011/10/20/2218654.html
http://blog.csdn.net/jia20003/article/details/7724530
