matlab实现人群计数密度图标签文件生成
问题
近期在研究C^3 Framework系列之一:一个基于PyTorch的开源人群计数框架
为了实现自行标注数据集,也就是针对诸如MCNN等工程制作自己的mat文件,或者csv文件。
数据标定
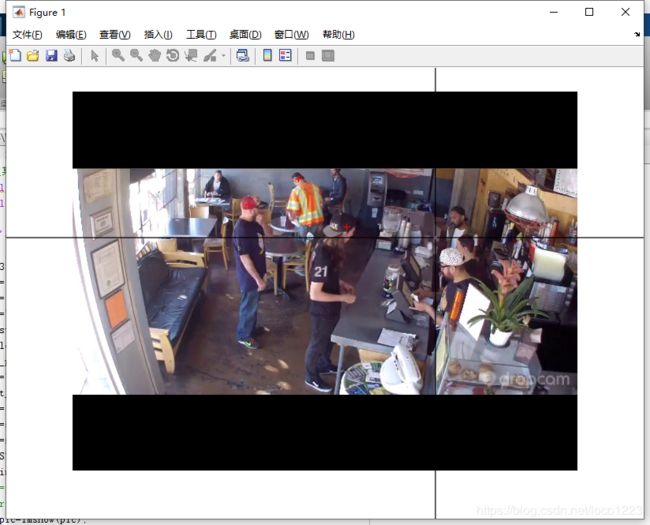
针对上述三张照片,通过matlab代码进行数据标定,标定过程类似于这样

对应代码
%对图片上某个点进行标注
clear all
close all
clc
set(gcf,'color','white')%图片的背景设置为白色
src='';
for i=1:3   %根据图片张数进行修改
    num = i;
    str = '.png' ;
    Mstr='.mat';
    filestr='C:\Users\WY\Desktop\c3\data_manager\data1\img\'; %路径,自行调整
    refilestr='C:\Users\WY\Desktop\c3\data_manager\data1\img\';
    left_par='pic';
    Mark='mark';
    right_par=')';
    STR = sprintf('%s%s%d%s%s', filestr,left_par,num, str) ;
    RSTR=sprintf('%s%s%d%s%s', refilestr,left_par,num , str) ;
    MSTR=sprintf('%s%s%d%s%s', refilestr,left_par,num, Mstr) ;
    MarkSTR=sprintf('%s%d%s', refilestr,Mark,num , Mstr) ;
    pic=imread(STR);
    %pic=imresize(pic_source,[602,800]);%调整图像的大小,
    %imwrite(pic,RSTR);%实际修改本地的图片
    showpic=imshow(pic);

    gt_point = [0,0];%用于存储标记点
    while(1)
        [x1,y1]=ginput(1);
        Atemp=[x1,y1];
        gt_point = [gt_point;Atemp];
        hold on
        plot(x1,y1,'r+');

        % Q键逐步撤销之前标注的点
        if strcmpi(get(gcf,'CurrentCharacter'),'q')
            if size(gt_point,1)>0
                gt_point(size(gt_point,1),:)=[];%非回车会以鼠标当前点做一次存储,这是多余的,删除
            end
            %重新做图
            close all
            showpic=imshow(pic);
            if size(gt_point,1) >0
                gt_point(size(gt_point,1),:)=[];
                for j = 1:size(gt_point,1)
                    hold on
                    plot(gt_point(j,1),gt_point(j,2),'r+');
                end
            end
        end

        %回车键结束本次图片标定
        if strcmpi(get(gcf,'CurrentCharacter'),char(13))
            break;
        end

    end
    gt_point(1,:)=[];%删除第一行多余的0行
    save(MSTR,'gt_point');
    close all
end
标定完成后再同一目录下生成了对应的标定文件,此时为mat文件格式,接下来进行mat文件
到csv文件的转换。
mat文件转换为csv文件
这部分由两个matlab文件组成,一个是用于进行高斯变换的程序,因为此时标定的mat文件格
式是这样的

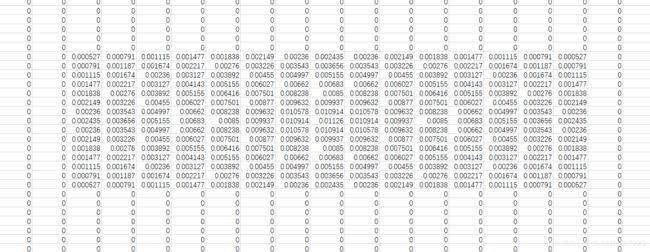
也就是标记了每个点的像素点位置,而实际的密度图标签格式是这样的

原因是将一个单个的标定像素点通过高斯变换为一块区域的非零值,这些值的和会是1
做高斯变换的原因大致可以理解为这样更便于进行神经网络进行信息学习,单个点的预测是不
切实际的,最终的人数估计也是通过统计生成数据的总和得到的。
两部分代码如下,其中部分部分可不需要修改
高斯转换matlab代码
function im_density = get_density_map_gaussian(im,points)


im_density = zeros(size(im));
[h,w] = size(im_density);

if(length(points)==0)
    return;
end

if(length(points(:,1))==1)
    x1 = max(1,min(w,round(points(1,1))));
    y1 = max(1,min(h,round(points(1,2))));
    im_density(y1,x1) = 255;
    return;
end
for j = 1:length(points)
    f_sz = 15;
    sigma = 4.0;
    H = fspecial('Gaussian',[f_sz, f_sz],sigma);
    x = min(w,max(1,abs(int32(floor(points(j,1))))));
    y = min(h,max(1,abs(int32(floor(points(j,2))))));
    if(x > w || y > h)
        continue;
    end
    x1 = x - int32(floor(f_sz/2)); y1 = y - int32(floor(f_sz/2));
    x2 = x + int32(floor(f_sz/2)); y2 = y + int32(floor(f_sz/2));
    dfx1 = 0; dfy1 = 0; dfx2 = 0; dfy2 = 0;
    change_H = false;
    if(x1 < 1)
        dfx1 = abs(x1)+1;
        x1 = 1;
        change_H = true;
    end
    if(y1 < 1)
        dfy1 = abs(y1)+1;
        y1 = 1;
        change_H = true;
    end
    if(x2 > w)
        dfx2 = x2 - w;
        x2 = w;
        change_H = true;
    end
    if(y2 > h)
        dfy2 = y2 - h;
        y2 = h;
        change_H = true;
    end
    x1h = 1+dfx1; y1h = 1+dfy1; x2h = f_sz - dfx2; y2h = f_sz - dfy2;
    if (change_H == true)
        H =  fspecial('Gaussian',[double(y2h-y1h+1), double(x2h-x1h+1)],sigma);
    end
    im_density(y1:y2,x1:x2) = im_density(y1:y2,x1:x2) +  H;

end

end
mat文件转csv代码
%%%%%%%%%%%%%%%%%%%%%%%%%%%%%%%%%%%%%%%%%%%%%%%%%%%%%%%
% File to create grount truth density map for test set%
%%%%%%%%%%%%%%%%%%%%%%%%%%%%%%%%%%%%%%%%%%%%%%%%%%%%%%%


clc; clear all;
%dataset = 'A';
%dataset_name = ['shanghaitech_part_' dataset ];
path = 'C:\Users\WY\Desktop\data_manager\data\img\';
gt_path = 'C:\Users\WY\Desktop\data_manager\data\den1\';
gt_path_csv = 'C:\Users\WY\Desktop\data_manager\data\csv\';

%mkdir(gt_path_csv )
%if (dataset == 'A')
%    num_images = 182;
%else
%    num_images = 316;
%end

for i = 1:3
%    if (mod(i,10)==0)
%        fprintf(1,'Processing %3d/%d files\n', i, num_images);
%    end
    load(strcat(gt_path, 'img',num2str(i),'.mat')) ;
    input_img_name = strcat(path,'img',num2str(i),'.jpg');
    im = imread(input_img_name);
    [h, w, c] = size(im);
    if (c == 3)
        im = rgb2gray(im);
    end
    annPoints =  gt_point;
    [h, w, c] = size(im);
    im_density = get_density_map_gaussian(im,annPoints);
    csvwrite([gt_path_csv ,'img',num2str(i) '.csv'], im_density);
end
参考:
人群密度图的生成(MATLAB+malldataset)
Matlab 密度图标定与生成

