hive实现50w词频统计与ctrip数据集销售额计算
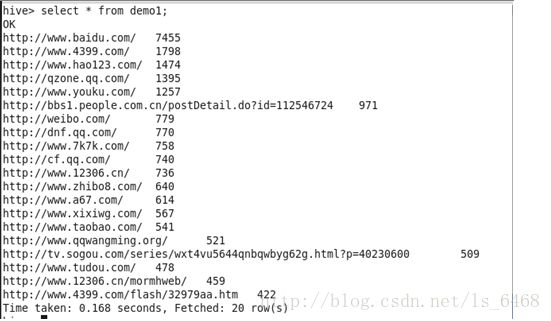
用hive对50万条记录(数据文件demo50w.utf8)进行词频统计,数据清洗转换自行处理,并列出词频最高的20个词。
首先准备好要统计单词的文件,并上传到hdfs上,登录hive,先创建一个表,这个表中只有一列数据,类型为string,用来存放统计单词的文件,把文件内容作为一个字符串存储。然后创建存放单词及计数结果的表,这个表的内容来自select嵌套查询。使用正则表达式进行匹配,从文件中筛选出网址,并统计出出现的频率,查询出频率在前二十的网址。
regexp_extract()为正则表达式,用来清洗数据,group by按单词分组,并按出现的次数排序,降序排序,limit限制显示的条数。
程序:
hive> create table doc_utf(line string);
hive> load data inpath‘/input/demo50w.utf8’ into table doc_utf8;
hive> create table demo1 as
> selectword,count(*) as count from
> (selectregexp_extract(line,'http://.*',0) word from doc_utf) word
> group byword
> order bycount desc
> limit 20;

已知ctrip数据集中ordquantity为订单数量,price为价格,则每个产品的销售额可以用price*ordquantity表示。如:1,2014-09-03,2,1,1,1,1,3,153这条数据,销售额为153*3=459.
(1)对ctrip数据集进行清洗,去掉不合法数据,统计合法数据条数。
(2)用hive对清洗后的数据进行统计,计算出2014年每月的销售额数据。
首先清洗数据。观察数据,可以看出price列,原始数据有负数,要把这样的记录清除掉,并查询出清洗后有多少条记录。然后建一个表查询出每日的销售量,最后再建一个表按每年的月份分组求和,求出月销售量。用到substring()函数,只显示年和月份。
建表导入数据:
hive> create table quantity
> (p_id int,
> p_date string,
> orderattribute1 int,
> orderattribute2 int,
> orderattribute3 int,
> orderattribute4 int,
> ciiquantity int,
> ordquantity int,
> price int)
> row format delimited
> fields terminated by ','
> lines terminated by '\n';
hive> load data local inpath'/home/ls/product_quantity.txt' into table quantity;
清洗数据:
hive> create table new_quantity as
> select * from quantity
> where month(p_date) between 1 and 12
> and day(p_date) between 1 and 31
> and (year(p_date)=2014 or year(p_date)=2015)
> and price>0;
查询有多少条记录:
hive> select count(*) from new_quantity;
依次建表计算出2014年每月的销售额数据:
hive> create table sale1 as
> select p_date,ordquantity*price as num1 from new_quantity;
hive> create table sale0 as
> select substring(p_date,1,7),sum(num1) as num
> from sale1
> where year(p_date)=2014
> group by substring(p_date,1,7);
hive> select * from sale0;
