pandas小记:pandas索引和选择
http://blog.csdn.net/pipisorry/article/details/18012125
检索/选择
索引选择时建议全部使用loc(尤其是修改df原本数据时),原因是最下面说的视图和显示拷贝。
dataframe列选择
和Series一样,在DataFrame中的一列可以通过字典记法或属性来检索,返回Series:
frame2[0] #选择第0列,最新版的好像已经不支持了,会报错
frame2['state']
frame2.year
Note: 返回的Series包含和DataFrame相同的索引,并它们的 name 属性也被正确的设置了。
dataframe选择多列
lines = lines[[0, 1, 4]]或者lines = lines[['user', 'check-in_time', 'location_id']]
dataframe连续选择多列(选择除最后一列的所有列示例)
df.ix[:,0:-1]
data_df[list(range(data_df.columns.size-1))] (或者在参数中构建一个列表来模拟)
dataframe选择最后一列
df[df.columns[-1]]或者df.ix[:,-1]
dataframe行选择
>>> dates = pd.date_range('20130101', periods=6)
df = pd.DataFrame(np.random.randn(6,4), index=dates, columns=list('ABCD'))
>>> dates
DatetimeIndex(['2013-01-01', '2013-01-02', '2013-01-03', '2013-01-04', '2013-01-05', '2013-01-06'],
dtype='datetime64[ns]', freq='D')
>>> df
A B C D
2013-01-01 2.036209 1.354010 -0.677409 -0.331978
2013-01-02 -1.403797 -1.094992 0.304359 -1.576272
2013-01-03 1.137673 0.636973 -0.746928 -0.606468
2013-01-04 0.833169 -2.575147 0.866364 1.337163
行可以直接通过[]选择,只是必须是数字范围或者字符串范围索引(不同于series只有数字或字符串也可以):
Note: 结束索引在这儿是被包含的!!!不同于numpy中的ndarray和python中的list的索引!!!
>>> df[1:2]
>>> df['2013-01-02':'2013-01-03']
A B C D
2013-01-02 -1.403797 -1.094992 0.304359 -1.576272
2013-01-03 1.137673 0.636973 -0.746928 -0.606468
series行选择
时间序列数据的索引技术
pandas 最基本的时间序列类型就是以时间戳(TimeStamp)为 index 元素的 Series 类型。
[pandas时间序列分析和处理Timeseries ]
Selection by Position ix和iloc
行也可以使用一些方法通过位置num或名字label来检索,例如 ix索引成员(field){更多ix使用实例可参考后面的“索引,挑选和过滤”部分}。
Note: 提取特定的某列数据。Python中,可以使用iloc或者ix属性,但是ix更稳定一些。
ix{行选+行列选}
In [45]: frame2.ix['three']
year   2002
state  Ohio
pop    3.6
debt   NaN
Name: three
df.ix[3]
A -0.976627
B 0.766333
C -1.043501
D 0.554586
Name: 2013-01-04 00:00:00, dtype: float64
假设我们需数据第一列的前5行:
df.ix[:,0].head()
>>> df.ix[1:3, 0:3] #相当于df.ix[1:3, ['A', 'B', 'C']]
A B C
2013-01-02 -1.403797 -1.094992 0.304359
2013-01-03 1.137673 0.636973 -0.746928
iloc{行选;行列选}
Select via the position of the passed integers
与ix, [], at的区别是,iloc[3]选择是的数据第3行,而其它如ix[3]选择的是索引为3的那一行!
In [32]: df.iloc[3]
A    0.721555
B   -0.706771
C   -1.039575
D    0.271860
Name: 2013-01-04 00:00:00, dtype: float64
By integer slices, acting similar to numpy/python
In [33]: df.iloc[3:5,0:2]
                   A         B
2013-01-04  0.721555 -0.706771
2013-01-05 -0.424972  0.567020
By lists of integer position locations, similar to the numpy/python style
In [34]: df.iloc[[1,2,4],[0,2]]
                   A         C
2013-01-02  1.212112  0.119209
2013-01-03 -0.861849 -0.494929
2013-01-05 -0.424972  0.276232
For getting fast access to a scalar (equiv to the prior method)
In [38]: df.iat[1,1]
Out[38]: -0.17321464905330858
[Selection by Position]
.ix,.iloc,loc的区别和注意事项参考下面显式拷贝部分
[How to deal with SettingWithCopyWarning in Pandas?]
Selection by Label仅通过label选择行loc[]
For getting a cross section using a label
In [26]: df.loc[dates[0]]
A    0.469112
B   -0.282863
C   -1.509059
D   -1.135632
Name: 2013-01-01 00:00:00, dtype: float64
Selecting on a multi-axis by label
In [27]: df.loc[:,['A','B']]
                   A         B
2013-01-01  0.469112 -0.282863
2013-01-02  1.212112 -0.173215
2013-01-03 -0.861849 -2.104569
2013-01-04  0.721555 -0.706771
2013-01-05 -0.424972  0.567020
2013-01-06 -0.673690  0.113648
[Selection by Label]
最快的仅选择单数值at[]
For getting fast access to a scalar (equiv to the prior method)
In [31]: df.at[dates[0],'A']
Out[31]: 0.46911229990718628
布尔索引Boolean Indexing
Using a single column’s values to select data.
In [39]: df[df.A > 0]
                   A         B         C         D
2013-01-01  0.469112 -0.282863 -1.509059 -1.135632
2013-01-02  1.212112 -0.173215  0.119209 -1.044236
2013-01-04  0.721555 -0.706771 -1.039575  0.271860
A where operation for getting.
In [40]: df[df > 0]
                   A         B         C         D
2013-01-01  0.469112       NaN       NaN       NaN
...多个条件的布尔索引
df.loc[(df.price>=100)&(df.price<=1000),'classes']
过滤filtering
见下面成员资格-过滤方法isin()
索引,挑选和过滤
大多具体的索引规则见前面的“检索/选择”部分
Series索引和整数索引
Series索引( obj[...] )的工作原理类似与NumPy索引,除了可以使用Series的索引值,也可以仅使用整数索引。
In [102]: obj = Series(np.arange(4.), index=['a', 'b', 'c', 'd'])
In [103]: obj['b']     In [104]: obj[1]
Out[103]: 1.0          Out[104]: 1.0
In [105]: obj[2:4]     In [106]: obj[['b', 'a', 'd']]
Out[105]:              Out[106]:
c   2                  b    1
d   3                  a    0
d   3

In [107]: obj[[1, 3]]      In [108]: obj[obj < 2]
b   1                      a    0
d   3                      b    1
整数索引
操作由整数索引的pandas对象跟内置的Python数据结构 (如列表和元组)在索引语义上有些不同。
例如,你可能认为下面这段代码不会产生一个错误:
ser = pd.Series(np.arange(3.))
ser
Out[11]:
0 0.0
1 1.0
2 2.0
dtype: float64
ser[-1]
这里,有一个含有0,1,2的索引,很难推断出用户想要什么(基于标签或位置的索引);相反,一个非整数索引,就没有这样的歧义:
>>>ser2 = pd.Series(np.arange(3.), index=['a', 'b', 'c'])
>>>ser2[-1]
2.0
为了保持良好的一致性,如果轴索引含有索引器,那么根据整数进行数据选取的操作将总是面向标签的。这也包括用ix进行切片:
ser.ix[:1]
Out[15]:
0 0.0
1 1.0
dtype: float64
Series的iget_ value 方法、DataFrame 的 irow 和 icol 方法
如果你需要可靠的、不考虑索引类型的、基于位置的索引,可以使用Series的iget_ value 方法和 DataFrame 的 irow 和 icol 方法:
>>> ser3 = pd.Series(range(3), index=[-5, 1, 3])
>>> ser3.iget_value(2)
2
>>> frame = pd.DataFrame(np.arange(6).reshape(3, 2), index=[2,0,1])
frame
Out[21]:
0 1
2 0 1
0 2 3
1 4 5
>>> frame.irow(0)
0 0
1 1
Name: 2, dtype: int32
标签切片
使用标签来切片和正常的Python切片并不一样,它会把结束点也包括在内:
In [109]: obj['b':'c']
b   1
c   2
索引赋值
使用这些函数来赋值
In [110]: obj['b':'c'] = 5
In [111]: obj
a   0
b   5
c   5
d   3
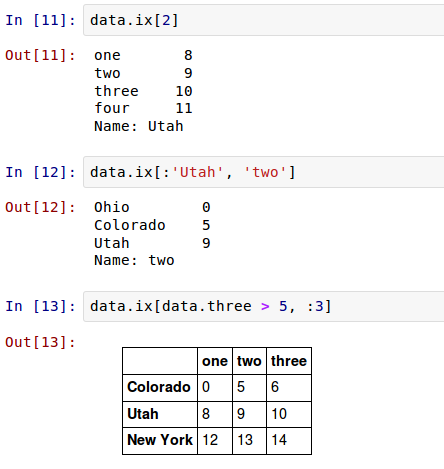
通过切片或一个布尔数组来选择行,这旨在在这种情况下使得DataFrame的语法更像一个ndarry。
In [116]: data[:2]             In [117]: data[data['three'] > 5]
         one two three four             one two three four
Ohio       0   1     2    3    Colorado   4   5     6    7
Colorado   4   5     6    7    Utah       8   9    10   11
                               New York  12  13    14   15
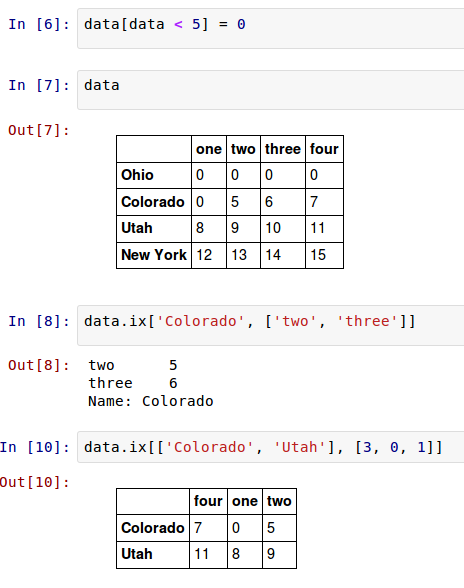
DataFrame行标签索引 ix
DataFrame可以在行上进行标签索引,使你可以从DataFrame选择一个行和列的子集,使用像NumPy的记法再加上轴标签。这也是一种不是很冗长的重新索引的方法:
因此,有很多方法来选择和重排包含在pandas对象中的数据。
DataFrame方法的简短概要
还有分层索引及一些额外的选项。
| obj[val] | 从DataFrame选择单一列或连续列。特殊情况下的便利:布尔数组(过滤行),切片(行切片),或布尔DataFrame(根据一些标准来设置值)。 |
|---|---|
| obj.ix[val] | 从DataFrame的行集选择单行 |
| obj.ix[:, val] | 从列集选择单列 |
| obj.ix[val1, val2] | 选择行和列 |
| reindex 方法 | 转换一个或多个轴到新的索引 |
| xs 方法 | 通过标签选择单行或单列到一个Series |
| icol, irow 方法 | 通过整数位置,分别的选择单行或单列到一个Series |
| get_value, set_value 方法 | 通过行和列标选择一个单值 |
Note:在设计pandas时,我觉得不得不敲下 frame[:, col] 来选择一列,是非常冗余的(且易出错的),因此列选择是最常见的操作之一。因此,我做了这个设计权衡,把所有的富标签索引引入到ix 。
[Different Choices for Indexing]
唯一值、值计数以及成员资格
唯一值、值计数、成员资格方法
方法 说明
isin 计算一个表示“Series各值是否包含于传入的值序列中”的布尔型数组
unique 计算Series中的唯一值数组,按发现的顺序返回
value_counts 返回一个Series,其索引为唯一值,其值为频率,按计数值降序排列
这类方法可以从一维Series的值中抽取信息。
过滤方法isin()
用于判断矢量化集合的成员资格,可用于选取Series中或DataFrame列中 数据的子集。
isin()中参数可以配合下面的unique()得到。
>>> obj=Series(['c','a','d','a','a','b','b','c','c'])
>>>mask=obj.isin(['b','c'])
>>> mask
0 True...
8 True
dtype: bool
>>> obj[mask]
0 c
5 b
6 b
7 c
8 c
Using the isin() method for filtering:
In [43]: df2
                   A         B         C         D      E
2013-01-01  0.469112 -0.282863 -1.509059 -1.135632    one
2013-01-02  1.212112 -0.173215  0.119209 -1.044236    one
2013-01-03 -0.861849 -2.104569 -0.494929  1.071804    two
2013-01-04  0.721555 -0.706771 -1.039575  0.271860  three
2013-01-05 -0.424972  0.567020  0.276232 -1.087401   four
2013-01-06 -0.673690  0.113648 -1.478427  0.524988  three

In [44]: df2[df2['E'].isin(['two','four'])]
Out[44]:
                   A         B         C         D     E
2013-01-03 -0.861849 -2.104569 -0.494929  1.071804   two
2013-01-05 -0.424972  0.567020  0.276232 -1.087401  four
过滤索引
Series.drop([labels, axis, index, columns, …]) Return Series with specified index labels removed.DataFrame.drop([labels, axis, index, …]) Drop specified labels from rows or columns.
Note: 原数据不会变,只有赋值给新的数据才没有那一行或列。
示例
a_series = a_series.drop(a_index)
而不需要这样的操作a_series = a_series[a_series.index.drop(a_index)]
unique()
得到Series中的唯一值一维ndarray数组。
>>>uniques = obj.unique()
>>>uniques
array(['c', 'a', 'd', 'b'], dtype=object)
返冋的唯一值是未排序的,如果需要的话,可以对结果再次进行排序(uniques. sort())。
value_counts
用于计算一个Series中各值出现的频率:
>>> obj.value_counts()
c 3
a 3
b 2
d 1
dtype: int64
为了便于査看,结果Series是按值频率降序排列的。
查源码,发现这个统计是通过hashtable实现的。keys, counts = htable.value_count_scalar64(values, dropna)
统计数组或序列所有元素出现次数pd.value_counts
value_counts还是一个顶级pandas方法,可用于任何数组或序列:
>>> pd.value_counts(obj.values, sort=False)
a 3
c 3
b 2
d 1
dtype: int64
返回一个pandas.series对象,不过你基本可以将它当成dict一样使用。
当然也可以减去一些判断,直接使用pandas.value_counts()调用的hashtable统计方法(lz在源码中看到的)
import pandas.hashtable as htable
values = np.array([1, 2, 3, 5, 1, 3, 3, 2, 3, 5])
values_cnts = dict(zip(*htable.value_count_scalar64(values, dropna=True)))
print(values_cnts)
apply应用于DataFrame
有时,可能希望得到DataFrame中多个相关列的一张柱状图。例如:
>>>data = pd.DataFrame({'Qu1': [1, 3, 4, 3, 4],'Qu2': [2, 3, 1, 2, 3],'Qu3': [1, 5, 2, 4, 4]})
>>>data
Qu1 Qu2 Qu3
0 1 2 1
1 3 3 5
2 4 1 2
3 3 2 4
4 4 3 4
将 pandas.value_counts 传给该 DataFrame 的 apply 函数:
In[25]: data.apply(pd.value_counts).fillna(0)
Qu1 Qu2 Qu3
1 1.0 1.0 1.0
2 0.0 2.0 1.0
3 2.0 2.0 0.0
4 2.0 0.0 2.0
5 0.0 0.0 1.0
[Histogramming and Discretization]
皮皮blog
索引Index及索引对象obj.index
索引
Many of these methods or variants thereof are available on the objectsthat contain an index (Series/Dataframe) and those should most likely beused before calling these methods directly.
从series对象中找到某元素(行)对应的索引
(如果索引是从0开始的连续值,那就是行号了)
nodes_id_index = pd.Index(nodes_series)
print(nodes_id_index.get_loc('u_3223_4017'))
[Find element's index in pandas Series]
[Index.get_loc]
更多请参考[Index]
索引对象obj.index
pandas的索引对象用来保存坐标轴标签和其它元数据(如坐标轴名或名称)。构建一个Series或DataFrame时任何数组或其它序列标签在内部转化为索引:
In [68]: obj = Series(range(3), index=['a', 'b', 'c'])
In [69]: index = obj.index
In [70]: index
Out[70]: Index([a, b, c], dtype=object)
In [71]: index[1:]
Out[71]: Index([b, c], dtype=object)
不可变性
索引对象是不可变的,因此不能由用户改变:
In [72]: index[1] = 'd'
Exception Traceback (most recent call last)...
Exception:  object is immutable
索引对象的不可变性非常重要,这样它可以在数据结构中结构中安全的共享:
In [73]: index = pd.Index(np.arange(3))
In [74]: obj2 = Series([1.5, -2.5, 0], index=index)
In [75]: obj2.index is index
Out[75]: True
pandas中的主要索引对象
表格 是库中内建的索引类清单。通过一些开发努力,索引可以被子类化,来实现特定坐标轴索引功能。多数用户不必要知道许多索引对象的知识,但是它们仍然是pandas数据模型的重要部分。
| Index | 最通用的索引对象,使用Python对象的NumPy数组来表示坐标轴标签。 |
|---|---|
| Int64Index | 对整形值的特化索引。 |
| MultiIndex | “分层”索引对象,表示单个轴的多层次的索引。可以被认为是类似的元组的数组。 |
| DatetimeIndex | 存储纳秒时间戳(使用NumPy的datetime64 dtyppe来表示)。 |
| PeriodIndex | 对周期数据(时间间隔的)的特化索引。 |
固定大小集合功能
除了类似于阵列,索引也有类似固定大小集合一样的功能
In [76]: frame3
state Nevada Ohio
year
2000     NaN  1.5
2001     2.4  1.7
2002     2.9  3.6

In [77]: 'Ohio' in frame3.columns
Out[77]: True
In [78]: 2003 in frame3.index
Out[78]: False
索引方法和属性
每个索引都有许多关于集合逻辑的方法和属性,且能够解决它所包含的数据的常见问题。
| append | 链接额外的索引对象,产生一个新的索引 |
|---|---|
| diff | 计算索引的差集 |
| intersection | 计算交集 |
| union | 计算并集 |
| isin | 计算出一个布尔数组表示每一个值是否包含在所传递的集合里 |
| delete | 计算删除位置i的元素的索引 |
| drop | 计算删除所传递的值后的索引 |
| insert | 计算在位置i插入元素后的索引 |
| is_monotonic | 返回True,如果每一个元素都比它前面的元素大或相等 |
| is_unique | 返回True,如果索引没有重复的值 |
| unique | 计算索引的唯一值数组 |
删除某个索引
参考上面的过滤索引。
[Index objects]
皮皮blog
重建索引reindex
pandas对象的一个关键的方法是 reindex ,意味着使数据符合一个新的索引来构造一个新的对象。
reindex更多的不是修改pandas对象的索引,而只是修改索引的顺序,如果修改的索引不存在就会使用默认的None代替此行。且不会修改原数组,要修改需要使用赋值语句。
| index | 作为索引的新序列。可以是索引实例或任何类似序列的Python数据结构。一个索引被完全使用,没有任何拷贝。 |
|---|---|
| method | 插值(填充)方法,见表格5-4的选项 |
| fill_value | 代替重新索引时引入的缺失数据值 |
| limit | 当前向或后向填充时,最大的填充间隙 |
| level | 在多层索引上匹配简单索引,否则选择一个子集 |
| copy | 如果新索引与就的相等则底层数据不会拷贝。默认为True(即始终拷贝) |
In [79]: obj = Series([4.5, 7.2, -5.3, 3.6], index=['d', 'b', 'a', 'c'])
In [80]: obj
d  4.5
b  7.2
a -5.3
c  3.6
reindex 重排数据(行索引)
在Series上调用 reindex 重排数据,使得它符合新的索引,如果那个索引的值不存在就引入缺失数据值:
In [81]: obj2 = obj.reindex(['a', 'b', 'c', 'd', 'e'])
In [82]: obj2
a -5.3
b 7.2
c 3.6
d 4.5
e NaN
In [83]: obj.reindex(['a', 'b', 'c', 'd', 'e'], fill_value=0)
a -5.3
b 7.2
c 3.6
d 4.5
e 0.0
重建索引的内插或填充method
为了对时间序列这样的数据排序,当重建索引的时候可能想要对值进行内插或填充。 method 选项可以是你做到这一点,使用一个如ffill 的方法来向前填充值:
In [84]: obj3 = Series(['blue', 'purple', 'yellow'], index=[0, 2, 4])
In [85]: obj3.reindex(range(6), method='ffill')
0   blue
1   blue
2 purple
3 purple
4 yellow
5 yellow
method 选项的清单
| 参数 | 描述 |
|---|---|
| ffill或pad | 前向(或进位)填充 |
| bfill或backfill | 后向(或进位)填充 |
对于DataFrame, reindex 可以改变(行)索引,列或两者。当只传入一个序列时,结果中的行被重新索引了:
In [86]: frame = DataFrame(np.arange(9).reshape((3, 3)), index=['a', 'c', 'd'], columns=['Ohio', 'Texas', 'California'])
In [87]: frame
  Ohio Texas California
a    0     1          2
c    3     4          5
d    6     7          8
列重新索引关键字columns
使用 columns 关键字可以是列重新索引:
In [90]: states = ['Texas', 'Utah', 'California']
In [91]: frame.reindex(columns=states)
   Texas Utah California
a      1  NaN          2
c      4  NaN          5
d      7  NaN          8
DataFrame重命名列columns方法2:
df.rename(columns={'age': 'x', 'fat_percent': 'y'})行列同时重新索引2种方式
一次可以对两个重新索引,可是插值只在行侧(0坐标轴)进行:
In [92]: frame.reindex(index=['a', 'b', 'c', 'd'], method='ffill', columns=states)
   Texas Utah California
a      1  NaN          2
b      1  NaN          2
c      4  NaN          5
d      7  NaN          8
正如你将看到的,使用带标签索引的 ix 可以把重新索引做的更简单:
In [93]: frame.ix[['a', 'b', 'c', 'd'], states]
  Texas Utah California
a     1  NaN          2
b   NaN  NaN        NaN
c     4  NaN          5
d     7  NaN          8
DataFrame索引和列的互转set_index reset_index
人们经常想要将DataFrame的一个或多个列当做行索引来用,或者可能希望将行索引变成DataFrame的列。以下面这个DataFrame为例:
frame = pd.DataFrame({'a': range(7),'b': range(7, 0, -1),'c': ['one','one','one','two','two','two', 'two'],'d': [0, 1, 2, 0, 1, 2, 3]})
frame
a b c d
0 0 7 one 0
1 1 6 one 1
2 2 5 one 2
3 3 4 two 0
4 4 3 two 1
5 5 2 two 2
6 6 1 two 3
列转换为行索引set_index
DataFrame的set_index函数会将其一个或多个列转换为行索引,创建一个新的 DataFrame :
frame2 = frame.set_index(['c', 'd'])
In [6]: frame2
a b
c d
one 0 0 7
1 1 6
2 2 5
two 0 3 4
1 4 3
2 5 2
3 6 1
默认情况下,那些列会从DataFrame中移除,但也可以将其保留下来:
frame.set_index(['c','d'], drop=False)
a b c d
c d
one 0 0 7 one 0
1 1 6 one 1
2 2 5 one 2
two 0 3 4 two 0
1 4 3 two 1
2 5 2 two 2
3 6 1 two 3
[没有reduce的分组参考group部分]
索引的级别会被转移到列reset_index
reset_index的功能跟set_index刚好相反,层次化索引的级别会被转移到列里面:
frame2.reset_index()
c d a b
0 one 0 0 7
1 one 1 1 6
2 one 2 2 5
3 two 0 3 4
4 two 1 4 3
5 two 2 5 2
6 two 3 6 1
[MultiIndex / Advanced Indexing]
皮皮blog
显式拷贝
索引DataFrame时返回的列是底层数据的一个视窗,而不是一个拷贝。因此,任何在Series上的就地修改都会影响DataFrame。列可以使用Series的copy 函数来显示拷贝。
Note:While standard Python / Numpy expressions for selecting and setting are intuitive and come in handy for interactive work, for production code, were commend the optimized pandas data access methods,.at,.iat,.loc,.ilocand.ix.
SettingWithCopyWarning提示
SettingWithCopyWarning: A value is trying to be set on a copy of a slice from a DataFrame
df[len(df.columns) - 1][df[len(df.columns) - 1] > 0.0] = 1.0
这个warning主要是第二个索引导致的,就是说第二个索引是copy的。
奇怪的是,df的确已经修改了,而warnning提示好像是说修改被修改到df的一个copy上了。所以这里只是一个warnning,只是说和内存有关,可能赋值不上,也可能上了。
且print(df[len(df.columns) - 1][df[len(df.columns) - 1] > 0.0].is_copy)输出None,怎么就输出None,而不是True或者False?
解决
修改df原本数据时建议使用loc,但是要注意行列的索引位置Try using .loc[row_indexer,col_indexer] = value instead
df.loc[df[len(df.columns) - 1] > 0.0, len(df.columns) - 1] = 1.0不建议设置不提示:pd.options.mode.chained_assignment = None # default='warn'
参考前面why .ix is a bad idea部分
[为什么有这种warnning的官方解释:Returning a view versus a copy¶]
[Pandas SettingWithCopyWarning]
[How to deal with SettingWithCopyWarning in Pandas?]
Why .ix is a bad idea
通过.ix选择的数据是一个copy的数据,修改这个选择不会修改原数据,而.loc是修改原数据。
The .ix object tries to do more than one thing, and for anyone who has read anything about clean code, this is a strong smell.
Given this dataframe:
df = pd.DataFrame({"a": [1,2,3,4], "b": [1,1,2,2]})Two behaviors:
dfcopy = df.ix[:,["a"]]
dfcopy.a.ix[0] = 2
Behavior one: dfcopy is now a stand alone dataframe. Changing it will not change df
df.ix[0, "a"] = 3Behavior two: This changes the original dataframe.
Use .loc instead
The pandas developers recognized that the .ix object was quite smelly[speculatively] and thus created two new objects which helps in the accession and assignment of data.
.loc is faster, because it does not try to create a copy of the data.
.loc is meant to modify your existing dataframe inplace, which is more memory efficient.
.loc is predictable, it has one behavior.
[Returning a view versus a copy]
带有重复值的轴索引
带有重复索引值的Series
>>>obj = Series(range(5), index=['a','a','b','b','c'])
>>>obj
a 0
a 1
b 2
b 3
c 4
索引的is_unique属性
验证是否是唯一的
>>>obj.index.is_unique
False
带有重复值索引的数据选取
如果某个索引对应多个值,则 返回一个Series;而对应单个值的,则返回一个标量值。
>>>obj['a']
a 0
a 1
>>>obj['c']
4
对DataFrame的行进行索引时也是如此:
>>> df = DataFrame(np.random.randn(4, 3), index=['a','a','b','b'])
>>>df
>>> df.ix['b']
层次化索引
层次化索引(hierarchical indexing)是pandas的一项重要功能,它能在一个轴上拥有多个(两个以上)索引级别。抽象点说,它使能以低维度形式处理高维度数据。
Series
创建一个Series,并用一个由列表或数组组成的列表作为索引
data = pd.Series(np.random.randn(10), index=[['a','a','a','b','b','b','c','c','d','d'], [1, 2, 3, 1, 2, 3, 1, 2, 2, 3]])
In [6]: data
a 1 0.382928
2 -0.360273
3 -0.533257
b 1 0.341118
2 0.439390
3 0.645848
c 1 0.006016
2 0.700268
d 2 0.405497
3 0.188755
dtype: float64
这就是带有Multilndex索引的Series的格式化输出形式。索引之间的“间隔”表示“直 接使用上面的标签”。
>>> data.index
MultiIndex(levels=[[u'a', u'b', u'c', u'd'], [1, 2, 3]], labels=[[0, 0, 0, 1, 1, 1, 2, 2, 3, 3], [0, 1, 2, 0, 1, 2, 0, 1, 1, 2]])
层次化索引的对象选取数据子集
In [8]: data['b':'c']
b 1 0.341118
2 0.439390
3 0.645848
c 1 0.006016
2 0.700268
dtype: float64
In [10]: data.ix[['b', 'd']]
b 1 0.341118
2 0.439390
3 0.645848
d 2 0.405497
3 0.188755
dtype: float64
内层”中进行选取
In [11]: data[:, 2]
a -0.360273
b 0.439390
c 0.700268
d 0.405497
dtype: float64
层次化索引在数据重塑和基于分组的操作:堆叠和反堆叠
(如透视表生成)中扮演着重要的角色
可通过其unstack方法被重新安排到一个DataFrame中:
In [12]: data.unstack()
1 2 3
a 0.382928 -0.360273 -0.533257
b 0.341118 0.439390 0.645848
c 0.006016 0.700268 NaN
d NaN 0.405497 0.188755
#unstack的逆运览是stack:data.unstack().stack()
DataFrame
对于一个DataFrame,每条轴都可以有分层索引:
frame = pd.DataFrame(np.arange(12).reshape((4, 3)),index=[['a','a','b','b'], [1, 2, 1, 2]],columns=[['Ohio','Ohio','Colorado'],
['Green','Red','Green']])
In [16]: frame
Ohio Colorado
Green Red Green
a 1 0 1 2
2 3 4 5
b 1 6 7 8
2 9 10 11
各层都可以有名字index.name
(可以是字符串,也可以是別的Python对象)。如果指定了名称,它 们就会显示在控制台输出中(不要将索引名称跟轴标签混为一谈!):
In [18]: frame.index.names = ['key1','key2']
In [19]: frame.columns.names = ['state', 'color']
In [20]: frame
state Ohio Colorado
color Green Red Green
key1 key2
a 1 0 1 2
2 3 4 5
b 1 6 7 8
2 9 10 11
分部的列索引选取列分组
In [21]: frame['Ohio']
color Green Red
key1 key2
a 1 0 1
2 3 4
b 1 6 7
2 9 10
单独创建Multilndex复用
pd.MultiIndex.from_arrays([['Ohio', 'Ohio', 'Colorado'],['Green','Red', 'Green']],names=['state', 'color'])
重排分级顺序swaplevel和sortlevel
如需要重新调整某条轴上各级别的顺序,或根据指定级别上的值对数据进行排序。
调整某条轴上各级别的顺序swaplevel
swaplevel接受两个级别编号或名称,并返回一个互换了级别的新对象(但数据不会发生变化):
In [24]: frame
state Ohio Colorado
color Green Red Green
key1 key2
a 1 0 1 2
2 3 4 5
b 1 6 7 8
2 9 10 11
In [25]: frame.swaplevel('key1','key2')
state Ohio Colorado
color Green Red Green
key2 key1
1 a 0 1 2
2 a 3 4 5
1 b 6 7 8
2 b 9 10 11
Note: 同frame.swaplevel(0,1)?
指定级别上的值对数据进行排序sortlevel
而sortlevel则根据单个级别中的值对数据进行排序(稳定的)。交换级別时,常常也会 用到sortlevel,这样最终结果就是有序的了:
In [26]: frame.sortlevel(1)
state Ohio Colorado
color Green Red Green
key1 key2
a 1 0 1 2
b 1 6 7 8
a 2 3 4 5
b 2 9 10 11
In [27]: frame.swaplevel(0,1).sortlevel(0)
state Ohio Colorado
color Green Red Green
key2 key1
1 a 0 1 2
b 6 7 8
2 a 3 4 5
b 9 10 11
Note:在层次化索引的对象上,如果索引是按字典方式从外到内排序(即调用sortlevel(0)或 sort_index()的结果),数据选取操作的性能要好很多。
根据级别汇总统计
许多对DataFrame和Series的描述和汇总统计都有一个level选项,它用于指定在某条轴上求和的级别,根据行或列上的级別来进行求和
In [29]: frame
state Ohio Colorado
color Green Red Green
key1 key2
a 1 0 1 2
2 3 4 5
b 1 6 7 8
2 9 10 11
In [30]: frame.sum(level='key2')
state Ohio Colorado
color Green Red Green
key2
1 6 8 10
2 12 14 16
In [33]: frame.sum(level='color',axis=1)
color Green Red
key1 key2
a 1 2 1
2 8 4
b 1 14 7
2 20 10
In [35]: frame.sum(level='color')
...
AssertionError: Level color not in index
[MultiIndex / Advanced Indexing]
from: http://blog.csdn.net/pipisorry/article/details/18012125
ref: [Indexing and Selecting Data¶]*