Prometheus + Grafana 接入实践
文章目录
- Prometheus 系统监控
- 数据模型
- jobs
- 安装
- Grafana 可视化
- 应用监控接入
- exporter 接入
- 应用中集成 prometheus client
- 告警 Alertmanager
- 参考
Prometheus 系统监控
Prometheus 是一套开源的系统监控告警框架,作为 CNCF 中重要的一员,活跃度仅次于 kubernetes,广泛用于 kubernetes 集群的监控系统中。
prometheus 架构如下:
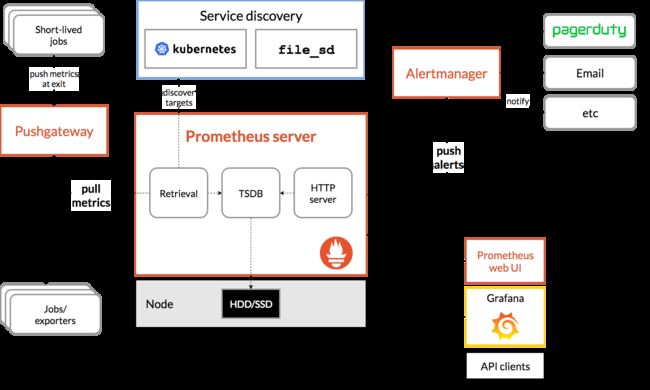
Prometheus server 会定期从配置的 target 或者 pushGateway (收集短生存期的jobs) 通过 http 主动拉取 metrics 存储到本地,并根据定义的规则保存到时间序列中,并向 alertmaanger 推送告警。
PromQL 是内置的查询工具,通过 API 或者其他可视化工具,如 Grafana, 查询存储在时序数据库中的样本,进行分析展示。
采集对象可以通过服务发现或者直接静态配置 job 指定。有些 jobs 存活的时间很多,无法等 prometheus 定期去拉取数据,通过将数据主动推给 pushGateway 保存,prometheus 在到 pushGateway 拉取。’
Prometheus 按照设定的规则向 Alertmanager 发送告警, Alertmanager 负责告警去重,分组,并送至正确的接受者(email,posGenie 等) 或者屏蔽。
数据模型
Prometheus 以 metric(指标)的形式保存所有采集的监控数据到内置的时序数据库中,同一 metric、label 的数据和时间戳形成时序数据流 :
metric_name 和 label 符合 :[a-zA-Z_:][a-zA-Z0-9_:]*
收集指标 metric 的类型一般分为:
- counter: 累加,比如总请求数,错误数等,随时间持续增加的样本;
- gauge: 测量值,反映实时的一个状态,如温湿度值,cpu使用率,其数值可上下波动;
- histogram: 直方图,如请求时间统计,对数据进行分区间统计,默认分布区间 buckets 为 {0.005,0.01,0.025,0.05,0.075,0.1,0.25,0.5,0.75,1,2.5,5,7.5,10},可以自定定义覆盖。每一个区间就像一个个 bucket(桶),histogram 将收到的样本计入配置的桶内,供后续分析。
# 包含 mertic:
metric_name_bucket{le="上边界"} # 小于等于的样本数
metric_name_bucket{le="+Inf"} # 样本总数
metric_name_sum,_count # 所有样本值的总和,样本总数
- summary: 摘要,类似 histogram,表示一段时间数据采样结果,请求持续时间,响应时间等;不同于 histogram,summary 直接存储了 quantile(分位数)值,而不是通过区间再取得计算结果。
metric_name{quantile="quantile-val"} # 指定 quantile 的样本数,50% 的相应时间是多少,90%的相应时间是多少
# objectives:map[float64]float64{0.5: 0.05, 0.9: 0.01, 0.99: 0.001}
metric_name_sum,_count # 同 histogram
参考 prometheus.io-metric_types
jobs
在 prometheus 中,会依据配置或者服务发现去拉取 metric,拉取的一个端点称为一个 instance(配置中一个 ip:port),一般对应一个进程;多个实例,提供相同的服务,这样一个集群被称为 jobs;如:
- job: api-server
- instance1: 1.2.3.4:5670
- instance 2: 1.2.3.4:5671
- instance 3: 5.6.7.8:5670
- instance 4: 5.6.7.8:5671
prometheus 会给每个样本自动加上 job 和 instance 的标签。
安装
项目主页 安装手册
通过 docker 可以很快速地启动 prometheus;
$ docker run --name prometheus -d -p 9090:9090 prom/prometheus
# docker-compose 指定配置文件参数
#command: --config.file=/prometheus_conf/prometheus.yml
通过 web 访问 http://127.0.0.1:9090/targets,可以看到 prometheus 监控自己的状态为 up;
Prometheus 配置参考
Grafana 可视化
Grafana 是一个跨平台的开源度量分析和可视化工具。
通过 docker 部署 grafana
$ docker run -d --name=grafana -p 3000:3000 grafana/grafana
登录 localhost:3000 默认的账号以及密码为 admin admin;
登录成功后,首先需要配置 Data Sources,type 选择 Prometheus,http 则是填写 prometheus 的接口地址(默认是 http://localhost:9090)。
[外链图片转存失败(img-TENkkNWP-1567582799872)(https://prometheus.io/assets/grafana_configuring_datasource.png)]
详细 参考
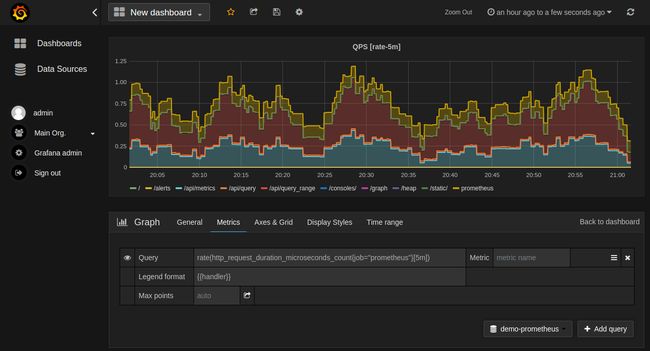
准备后数据源后,新建 dashboard,设置 metric 进行绘图。
应用监控接入
搭建完监控系统后,需要配置监控对象,使其暴露 metrics 给 Prometheus,定时通过 http 访问拉取数据。两种方式,一种直接通过 exporter 调用监控对象现有接口读取数据,再以 /metric 暴露出来,另一种是集合 prometheus 客户端库,实现 http svr。
exporter 接入
现在很多云原生应用都实现了 prometheus 的监控接口,如 etcd,k8s 等,可以直接被 prometheus 监控,对于没有提供的应用,如 redis,mysql,可以通过一个代理实现,叫做 exporter,exporter 通过调用被监控应用本身提供的接口获取数据,再将数据以 prometheus 的规范对外提供,如 node exporter(监控机器 cpu 内存等),mysql exporter, redis exporter 等。
如下,示例安装 redis exporter(redis 本地默认安装)
$ docker run --name redis_exporter -d --rm -p 9121:9121 oliver006/redis_exporter:latest
# docker-composer 指定参数
#  command: -redis.addr redis://redis:6379

# 获取 redis 监控数据
$ curl localhost:9121/metrics                               # HELP go_gc_duration_seconds A summary of the GC invocation durations.
# TYPE go_gc_duration_seconds summary
go_gc_duration_seconds{quantile="0"} 0
go_gc_duration_seconds{quantile="0.25"} 0
go_gc_duration_seconds{quantile="0.5"} 0
go_gc_duration_seconds{quantile="0.75"} 0
go_gc_duration_seconds{quantile="1"} 0
go_gc_duration_seconds_sum 0
go_gc_duration_seconds_count 0
# HELP go_goroutines Number of goroutines that currently exist.
# TYPE go_goroutines gauge
go_goroutines 6
....
修改 prometheus 配置,使其定时到 exporter 拉取数据:
docker 中配置文件:/etc/prometheus/prometheus.yml
scrape_configs:
- job_name: 'redis'
    static_configs:
    - targets: ['172.17.0.1:9121']
重启 prometheus,便可以在其 web 看到 redis 统计的数据了。
应用中集成 prometheus client
对于自己开发的应用,可以在应用中集合 prometheus 客户端,实现 /metric http 供 prometheus 读取监控数据实现上报。
对于 golang ,最简单的 example :
package main
import (
"log"
"net/http"
github.com/prometheus/client_golang/prometheus/promhttp
)
func main() {

    // expose prometheus metrics接口
    http.Handle("/metrics", promhttp.Handler())
    log.Fatal(http.ListenAndServe(":8080", nil))
}

// xxVec 定义了一系列具有相同描述的 metric,通过指定label区分
// prometheus.NewCounter
// prometheus.NewCounterVec
详细参考:
- golang-doc
- golang-metric
告警 Alertmanager
Alertmanager 接收 prometheus 警报后,会进行去重,分组,路由到对应的接收端进行个告警,如邮件,webhook,slack。。。
- grouping 分组
将性质类似的告警组成一类,如实例连接数据库失败,几百个一起上报,prometheus 会对应每个实例推送一警报报到 alertmanager,这是如果想看到那个服务那些实例受到影响,alermanager 会依据集群和警报名分组标签,推送一个告警。 - inhibition 抑制
一个告警已经触发,可以配置关心这个集群的其他警报无效,避免其他因此问题触发的问题发送大量警报通知。 - sliences 静默
设定时间忽略警报,不发告警。
参考
- prometheus入门
- grafana+prometheus
- prometheus exporter redis
- prometheus golang
- prometheus 非官方手册