FCN源码解读之vis.py
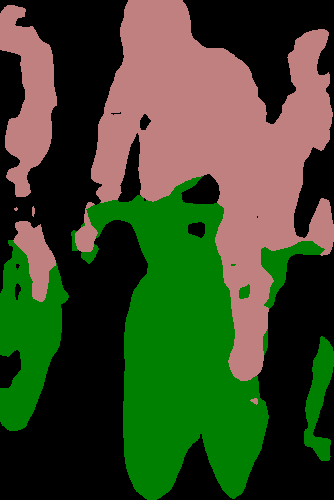
FCN中的vis.py用于测试时输出可视化分割图像,可以选择两种可视化输出,一种为直接可视化的彩色分割图(左图);一种为含有掩膜的分割图(原图与分割彩色图的加权融合,右图)。
vis.py源码如下:
import numpy as np


def make_palette(num_classes):
    """
    Maps classes to colors in the style of PASCAL VOC.
    Close values are mapped to far colors for segmentation visualization.
    See http://host.robots.ox.ac.uk/pascal/VOC/voc2012/index.html#devkit


    Takes:
        num_classes: the number of classes
    Gives:
        palette: the colormap as a k x 3 array of RGB colors
    """
    palette = np.zeros((num_classes, 3), dtype=np.uint8)
    for k in xrange(0, num_classes):
        label = k
        i = 0
        while label:
            palette[k, 0] |= (((label >> 0) & 1) << (7 - i))
            palette[k, 1] |= (((label >> 1) & 1) << (7 - i))
            palette[k, 2] |= (((label >> 2) & 1) << (7 - i))
            label >>= 3
            i += 1
    return palette


def color_seg(seg, palette):
    """
    Replace classes with their colors.


    Takes:
        seg: H x W segmentation image of class IDs
    Gives:
        H x W x 3 image of class colors
    """
    return palette[seg.flat].reshape(seg.shape + (3,))


def vis_seg(img, seg, palette, alpha=0.5):
    """
    Visualize segmentation as an overlay on the image.


    Takes:
        img: H x W x 3 image in [0, 255]
        seg: H x W segmentation image of class IDs
        palette: K x 3 colormap for all classes
        alpha: opacity of the segmentation in [0, 1]
    Gives:
        H x W x 3 image with overlaid segmentation
    """
    vis = np.array(img, dtype=np.float32)
    mask = seg > 0
    vis[mask] *= 1. - alpha
    vis[mask] += alpha * palette[seg[mask].flat]
    vis = vis.astype(np.uint8)
    return vis
源码解读如下:
(1)make_palette()
此函数通过输入的类别数(num_classes)生成一个调色板,每个类别对应一种颜色。
#生成调色板
def make_palette(num_classes):
    """
    Maps classes to colors in the style of PASCAL VOC.
    Close values are mapped to far colors for segmentation visualization.
    See http://host.robots.ox.ac.uk/pascal/VOC/voc2012/index.html#devkit


    Takes:
        num_classes: the number of classes 输入为类别数目
    Gives:
        palette: the colormap as a k x 3 array of RGB colors 输出为k×3大小的RGB颜色数组
    """
    palette = np.zeros((num_classes, 3), dtype=np.uint8)
    #xrange() 函数用法与 range 完全相同,所不同的是生成的不是一个数组,而是一个生成器
    for k in xrange(0, num_classes):
        label = k
        i = 0
        while label:  #按一定规则移位产生调色板
            palette[k, 0] |= (((label >> 0) & 1) << (7 - i)) #>>为二进制右移
            palette[k, 1] |= (((label >> 1) & 1) << (7 - i))
            palette[k, 2] |= (((label >> 2) & 1) << (7 - i))
            label >>= 3
            i += 1
    return palette
若输入的num_classes=21,则输出结果如下(每行对应一种颜色,从结果中也可以看出每个类别对应的颜色是不一样的):
[[  0   0   0]
 [128   0   0]
 [  0 128   0]
 [128 128   0]
 [  0   0 128]
 [128   0 128]
 [  0 128 128]
 [128 128 128]
 [ 64   0   0]
 [192   0   0]
 [ 64 128   0]
 [192 128   0]
 [ 64   0 128]
 [192   0 128]
 [ 64 128 128]
 [192 128 128]
 [  0  64   0]
 [128  64   0]
 [  0 192   0]
 [128 192   0]
 [  0  64 128]]
(2)color_seg()
此函数所产生的分割图像即如上面的左图。
#产生一个可视化的类别数组
def color_seg(seg, palette):
    """
    Replace classes with their colors.

    Takes:
        seg: H x W segmentation image of class IDs
        seg是score层产生的类别图(即每一像素的值是0-(num_classes-1)中的一个)
    Gives:
        H x W x 3 image of class colors
        生成一张三通道的彩色图(其中每一种颜色对应一种类别),实际生成是H×W×3的数组,需要经过python中但PIL库调用函数Image.fromarray将此数组转化为一张彩色图(详见infer.py最后几行)
    """
    return palette[seg.flat].reshape(seg.shape + (3,)) #按照类别进行上色
(3)vis_seg()
此函数所产生的分割图像即如上面的右图。
#产生一个可视化的含有分割掩膜数组(即包含原图和分割掩膜但数组,本质上就是两者的加权融合)
def vis_seg(img, seg, palette, alpha=0.5):  #alpha为透明度,也即加权融合因子
    """
    Visualize segmentation as an overlay on the image.

    Takes:
        img: H x W x 3 image in [0, 255] 原图
        seg: H x W segmentation image of class IDs 同color_seg中的seg
        palette: K x 3 colormap for all classes 调色板
        alpha: opacity of the segmentation in [0, 1] 透明度
    Gives:
        H x W x 3 image with overlaid segmentation 输出含有掩膜的大小为H×W×3的数组
    """
    vis = np.array(img, dtype=np.float32)  #将图像转换为数组
    mask = seg > 0  #产生去除背景(标号为0)的掩膜
    vis[mask] *= 1. - alpha  #原图像除背景外乘上alpha
    vis[mask] += alpha * palette[seg[mask].flat] #加上alpha倍的上色图(也除去了背景)
    vis = vis.astype(np.uint8) #强制转化为unchar型(图像像素0-255的限制,所以需要强制转换)
    return vis
