23-windows下filebeat与logstash与elasticSearch的合并使用
简介:windows下filebeat与logstash与elasticSearch的合并使用
- filebeat 收集运送日志
- logstash 过滤整合日志
- elasticSearch存储日志
1.要实现的模型

2.环境准备
elasticSearch安装
head安装
http://blog.csdn.net/qq_21383435/article/details/79312247
filebeat 安装:
http://blog.csdn.net/qq_21383435/article/details/79423360
3.启动head(以下都在cmd下运行)
D:\elasticsearch\elasticsearch-head-master>grunt server
>> Local Npm module "grunt-contrib-jasmine" not found. Is it installed?
(node:10896) ExperimentalWarning: The http2 module is an experimental API.

Running "connect:server" (connect) task
Waiting forever...
Started connect web server on http://localhost:9100
4.启动kibana
D:\elasticsearch\kibana-6.1.0-windows-x86_64\bin>kibana.bat
  log   [05:05:51.199] [info][status][plugin:[email protected]] Status changed from uninitialized to green - Ready
  log   [05:05:51.273] [info][status][plugin:[email protected]] Status changed from uninitialized to yellow - Waiting for Elasticsearch
  log   [05:05:51.296] [info][status][plugin:[email protected]] Status changed from uninitialized to green - Ready
  log   [05:05:51.318] [info][status][plugin:[email protected]] Status changed from uninitialized to green - Ready
  log   [05:05:51.919] [info][status][plugin:[email protected]] Status changed from uninitialized to green - Ready
  log   [05:05:51.925] [info][listening] Server running at http://0.0.0.0:5601
  log   [05:05:51.955] [info][status][plugin:[email protected]] Status changed from yellow to green - Ready
5.elasticsearch配置
cluster.name: elasticsearch
node.name: "lcc_node"
node.master: true
# 指定该节点是否存储索引数据,默认为true。
node.data: true

# 设置默认索引分片个数,默认为5片。
#index.number_of_shards: 1

# 设置默认索引副本个数,默认为1个副本。如果采用默认设置,而你集群只配置了一台机器,
# 那么集群的健康度为yellow,也就是所有的数据都是可用的,但是某些复制没有被分配
#index.number_of_replicas: 1

# 设置配置文件的存储路径,默认是es根目录下的config文件夹。
#path.conf: J:\elasticsearch\elasticsearch-6.2.1\config

# 设置索引数据的存储路径,默认是es根目录下的data文件夹,可以设置多个存储路径,用逗号隔开
#path.data: J:\elasticsearch\elasticsearch-6.2.1\data

# 设置临时文件的存储路径,默认是es根目录下的work文件夹。
#path.work: J:\elasticsearch\elasticsearch-6.2.1\worker

# 设置日志文件的存储路径,默认是es根目录下的logs文件夹
# path.logs: /path/to/logs

# 设置为true来锁住内存不进行swapping。因为当jvm开始swapping时es的效率 会降低,
# 所以要保证它不swap,可以把ES_MIN_MEM和ES_MAX_MEM两个环境变量设置成同一个值,
# 并且保证机器有足够的内存分配给es。 同时也要允许elasticsearch的进程可以锁住内存,
# linux下启动es之前可以通过`ulimit -l unlimited`命令设置。
# bootstrap.mlockall: true

network.host: 127.0.0.1
http.port: 9200

http.cors.enabled: true
http.cors.allow-origin: "*"


#action.auto_create_index : .security,.monitoring*,.watches,.triggered_watches,.watcher-history*
#xpack.security.enabled : false
#xpack.monitoring.enabled : true
#xpack.graph.enabled : false
#xpack.watcher.enabled : false
#xpack.ml.enabled : false


# 单个命令来删除所有数据可能会导致可怕的后果。这个设置使删除只限于特定名称指向的数据, 而不允许通过指定 _all 或通配符来删除指定索引库。
action.destructive_requires_name: true

#index.number_of_replicas: 0
#cluster.routing.allocation.enable : all
6.启动elasticsearch
D:\elasticsearch\elasticsearch-6.1.0\bin>elasticsearch.bat
[2018-03-07T13:05:09,488][INFO ][o.e.n.Node               ] [lcc_node] initializing ...
[2018-03-07T13:05:09,672][INFO ][o.e.e.NodeEnvironment    ] [lcc_node] using [1] data paths,
[2018-03-07T13:05:09,672][INFO ][o.e.e.NodeEnvironment    ] [lcc_node] heap size [1007.3mb],
7.配置filebeat
#=========================== Filebeat prospectors =============================
filebeat.prospectors:
# Each - is a prospector. Most options can be set at the prospector level, so
# you can use different prospectors for various configurations.
# Below are the prospector specific configurations.
- type: log
# Change to true to enable this prospector configuration.
enabled: true
# Paths that should be crawled and fetched. Glob based paths.
paths:
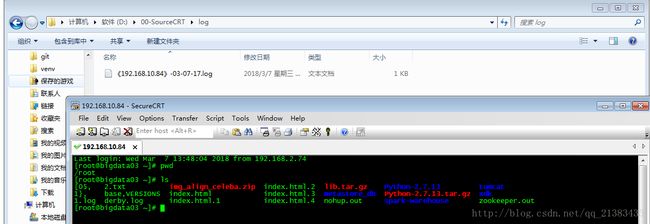
- D:/00-SourceCRT/log/*.log
#- c:\programdata\elasticsearch\logs\*
# Exclude lines. A list of regular expressions to match. It drops the lines that are
# matching any regular expression from the list.
#exclude_lines: ['^DBG']
# Include lines. A list of regular expressions to match. It exports the lines that are
# matching any regular expression from the list.
#include_lines: ['^ERR', '^WARN']
# Exclude files. A list of regular expressions to match. Filebeat drops the files that
# are matching any regular expression from the list. By default, no files are dropped.
#exclude_files: ['.gz$']
# Optional additional fields. These fields can be freely picked
# to add additional information to the crawled log files for filtering
#fields:
# level: debug
# review: 1
### Multiline options
# Mutiline can be used for log messages spanning multiple lines. This is common
# for Java Stack Traces or C-Line Continuation
# The regexp Pattern that has to be matched. The example pattern matches all lines starting with [
#multiline.pattern: ^\[
# Defines if the pattern set under pattern should be negated or not. Default is false.
#multiline.negate: false
# Match can be set to "after" or "before". It is used to define if lines should be append to a pattern
# that was (not) matched before or after or as long as a pattern is not matched based on negate.
# Note: After is the equivalent to previous and before is the equivalent to to next in Logstash
#multiline.match: after
#============================= Filebeat modules ===============================
filebeat.config.modules:
# Glob pattern for configuration loading
path: ${path.config}/modules.d/*.yml
# Set to true to enable config reloading
reload.enabled: false
# Period on which files under path should be checked for changes
#reload.period: 10s
#==================== Elasticsearch template setting ==========================
setup.template.settings:
index.number_of_shards: 3
#index.codec: best_compression
#_source.enabled: false
#================================ General =====================================
# The name of the shipper that publishes the network data. It can be used to group
# all the transactions sent by a single shipper in the web interface.
#name:
# The tags of the shipper are included in their own field with each
# transaction published.
#tags: ["service-X", "web-tier"]
# Optional fields that you can specify to add additional information to the
# output.
#fields:
# env: staging
#============================== Dashboards =====================================
# These settings control loading the sample dashboards to the Kibana index. Loading
# the dashboards is disabled by default and can be enabled either by setting the
# options here, or by using the `-setup` CLI flag or the `setup` command.
#setup.dashboards.enabled: false
# The URL from where to download the dashboards archive. By default this URL
# has a value which is computed based on the Beat name and version. For released
# versions, this URL points to the dashboard archive on the artifacts.elastic.co
# website.
#setup.dashboards.url:
#============================== Kibana =====================================
# Starting with Beats version 6.0.0, the dashboards are loaded via the Kibana API.
# This requires a Kibana endpoint configuration.
setup.kibana:
# Kibana Host
# Scheme and port can be left out and will be set to the default (http and 5601)
# In case you specify and additional path, the scheme is required: http://localhost:5601/path
# IPv6 addresses should always be defined as: https://[2001:db8::1]:5601
#host: "localhost:5601"
#============================= Elastic Cloud ==================================
# These settings simplify using filebeat with the Elastic Cloud (https://cloud.elastic.co/).
# The cloud.id setting overwrites the `output.elasticsearch.hosts` and
# `setup.kibana.host` options.
# You can find the `cloud.id` in the Elastic Cloud web UI.
#cloud.id:
# The cloud.auth setting overwrites the `output.elasticsearch.username` and
# `output.elasticsearch.password` settings. The format is `:` .
#cloud.auth:
#================================ Outputs =====================================
# Configure what output to use when sending the data collected by the beat.
#-------------------------- Elasticsearch output ------------------------------
#output.elasticsearch:
# Array of hosts to connect to. 这里注释掉了
# hosts: ["localhost:9200"]
# Optional protocol and basic auth credentials.
#protocol: "https"
#username: "elastic"
#password: "changeme"
#----------------------------- Logstash output --------------------------------
output.logstash:
# The Logstash hosts
hosts: ["localhost:5044"]
# Optional SSL. By default is off.
# List of root certificates for HTTPS server verifications
#ssl.certificate_authorities: ["/etc/pki/root/ca.pem"]
# Certificate for SSL client authentication
#ssl.certificate: "/etc/pki/client/cert.pem"
# Client Certificate Key
#ssl.key: "/etc/pki/client/cert.key"
#================================ Logging =====================================
# Sets log level. The default log level is info.
# Available log levels are: critical, error, warning, info, debug
#logging.level: debug
# At debug level, you can selectively enable logging only for some components.
# To enable all selectors use ["*"]. Examples of other selectors are "beat",
# "publish", "service".
#logging.selectors: ["*"]
8.配置logstash
在D:\elasticsearch\logstash-6.1.0目录下,新建first-pipeline.conf文件
input {
    beats {
        port => "5044"
    }
}
filter {
    grok {
        match => { "message" => "%{COMBINEDAPACHELOG}"}
    }
    geoip {
        source => "clientip"
    }
}
output {
    elasticsearch {
            hosts => "localhost:9200"     # es服务器
            index => "aa-%{+YYYY.MM.dd}" # es服务器索引格式
            document_type => "wjb_log"
        }
}
运行之前记得去掉注释:
不然会报错:http://blog.csdn.net/qq_21383435/article/details/79478419
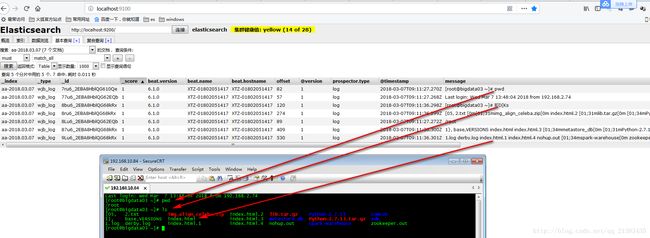
9.没运行之前查看
使用SourceCTR产生日志:http://blog.csdn.net/qq_21383435/article/details/79423360
查看head无数据,没有aa开头的索引
10。运行logStash
D:\elasticsearch\logstash-6.1.0\bin>logstash.bat -f ../first-pipeline.conf  --config.reload.automatic
Sending Logstash's logs to D:/elasticsearch/logstash-6.1.0/logs which is now configured via log4j2.properties
[2018-03-07T17:02:23,866][INFO ][logstash.modules.scaffold] Initializing module {:module_name=>"fb_apache", :
[2018-03-07T17:02:23,883][INFO ][logstash.modules.scaffold] Initializing module {:module_name=>"netflow", :di
[2018-03-07T17:02:24,144][WARN ][logstash.config.source.multilocal] Ignoring the 'pipelines.yml' file because
[2018-03-07T17:02:24,683][INFO ][logstash.runner          ] Starting Logstash {"logstash.version"=>"6.1.0"}
11 运行filebeat
D:\elasticsearch\filebeat-6.1.0-windows-x86_64>filebeat -e -c filebeat.yml -d "publish"
2018/03/07 09:31:26.380000 beat.go:436: INFO Home path: [D:\elasticsearch\filebeat-6.1.0-windows-x86_64]
\filebeat-6.1.0-windows-x86_64\data] Logs path: [D:\elasticsearch\filebeat-6.1.0-windows-x86_64\logs]
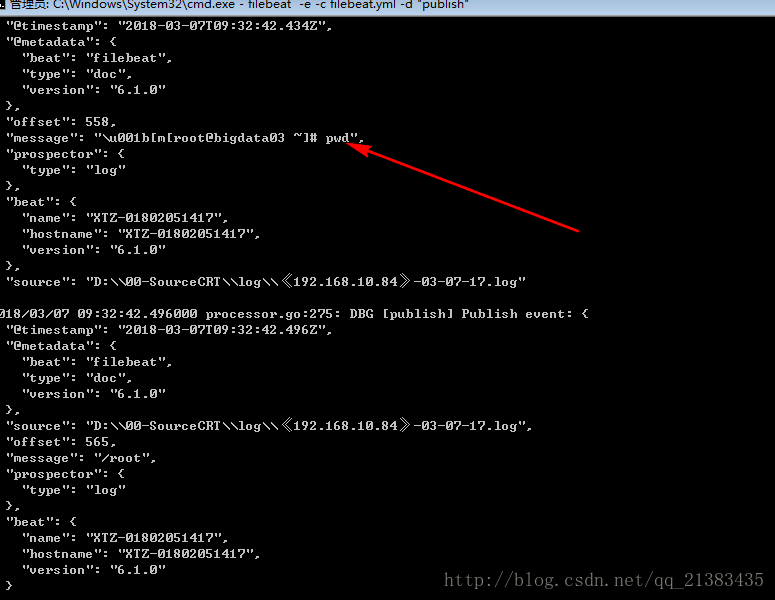
2018/03/07 09:31:26.380000 metrics.go:23: INFO Metrics logging every 30s12 开启sourceCTR 生成日志,我们敲一点命令
13.运行filebeat的cmd下打印如下
有我们打印的命令
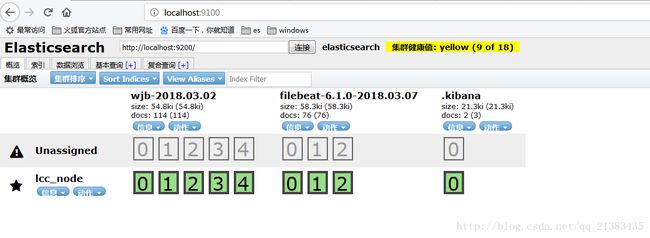
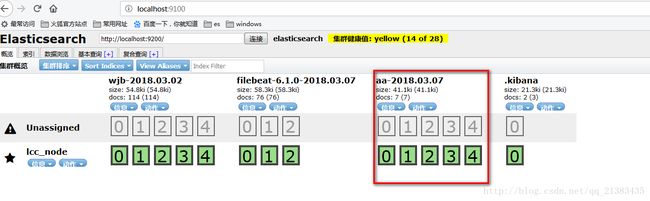
14 查看head
这里自动帮我们建立了索引
15 验证数据