python:画自定义图
- python画图,用于写论文作图等。
- 因变量从csv文件读取。自变量在一个区间等距取值,你需要修改区间或从文件读取自变量。
- 参数设置。
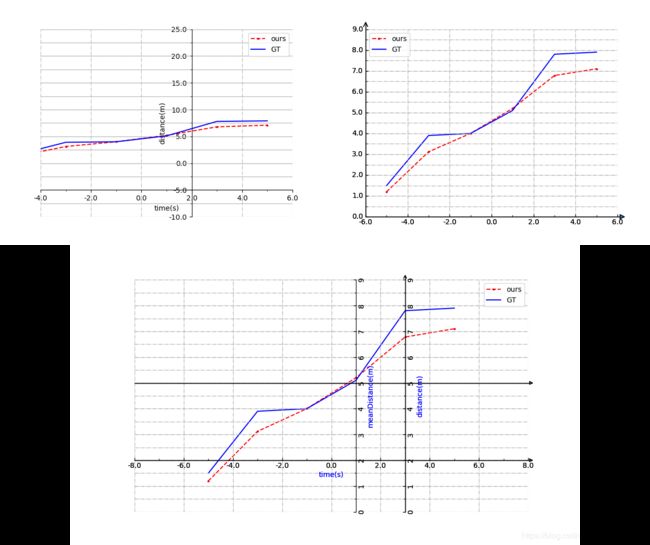
- 效果图如下:
图1对应的代码:
#encoding=utf-8
import matplotlib.pyplot as plt
import numpy as np
import pandas as pd
from matplotlib.ticker import MultipleLocator, FormatStrFormatter

#输入因变量。
y1 = pd.read_csv('2_1.csv')
y1 = np.array(y1)
y2 = pd.read_csv('2_2.csv')
y2 = np.array(y2)
assert y1.shape[0]==y2.shape[0], '两个因变量个数不相等!'

#设置自变量的范围和个数。设置折线属性。
x = np.linspace(-5, 5, y1.shape[0])
plt.plot(x,y1,'r-',label='ours', color='red', linestyle='dashed', marker='o', markerfacecolor='blue', markersize='2')
plt.plot(x,y2,'b-',label='GT')

#设置坐标轴标签。
#plt.figure(num='Name1',figsize=(10, 5),dpi=75,facecolor='#666666',edgecolor='#0000FF')#画布名称、画布大小、分辨率、背景颜色、边界颜色
plt.xlabel('time(s)')
plt.ylabel('distance(m)')

#获得坐标轴对象。
ax = plt.gca()
#隐藏右边界线、上边界线。
ax.spines['right'].set_color('none')
ax.spines['top'].set_color('none')
#设置坐标轴交点的坐标。
ax.spines['bottom'].set_position(('data', -5))
ax.spines['left'].set_position(('data', 2))
#设置x轴与下边界线重合、y轴与左边界线重合。
ax.xaxis.set_ticks_position('bottom')
ax.yaxis.set_ticks_position('left')
#设置坐标轴刻度。
ax.xaxis.set_major_locator(MultipleLocator(2))#将x主刻度标签设置为2的倍数
ax.xaxis.set_major_formatter(FormatStrFormatter('%1.1f'))#设置x轴主刻度格式
ax.xaxis.set_minor_locator(MultipleLocator(1))#将x轴次刻度标签设置为1的倍数
#ax.xaxis.set_minor_formatter(FormatStrFormatter('%1.1f'))#设置x轴次刻度格式
ax.yaxis.set_major_locator(MultipleLocator(5))#将x主刻度标签设置为2的倍数
ax.yaxis.set_major_formatter(FormatStrFormatter('%1.1f'))#设置x轴主刻度格式
ax.yaxis.set_minor_locator(MultipleLocator(2.5))#将x轴次刻度标签设置为1的倍数
#ax.yaxis.set_minor_formatter(FormatStrFormatter('%1.1f'))#设置x轴次刻度格式

#显示网格。
ax.grid(True, linestyle='-.')
ax.xaxis.grid(True, which='major') #x坐标轴的网格使用主刻度
ax.yaxis.grid(True, which='minor') #y坐标轴的网格使用次刻度

#坐标范围、标注位置。
#plt.axis('equal')#x轴和y轴的单位长度相同
plt.xlim(-4, 6)
plt.ylim(-10, 25)
#plt.axis([-4, 6, -10, 25])#等价于上两行
plt.legend(loc='best')#图例位置,plt.plot需要指定label
plt.savefig('1.png')
plt.show()
图2对应的代码:
#encoding=utf-8
import matplotlib.pyplot as plt
import mpl_toolkits.axisartist as axisartist
import pandas as pd
import numpy as np
from matplotlib.ticker import MultipleLocator, FormatStrFormatter

#创建画布和绘图区对象。
fig = plt.figure()
ax = axisartist.Subplot(fig, 111)
fig.add_axes(ax)

#输入因变量。
y1 = pd.read_csv('2_1.csv')
y1 = np.array(y1)
y2 = pd.read_csv('2_2.csv')
y2 = np.array(y2)
assert y1.shape[0]==y2.shape[0], '两个因变量个数不相等!'

#设置自变量的范围和个数。设置折线属性。
x = np.linspace(-5, 5, y1.shape[0])
plt.plot(x,y1,'r-',label='ours', color='red', linestyle='dashed', marker='o', markerfacecolor='blue', markersize='2')
plt.plot(x,y2,'b-',label='GT')

#隐藏右、上两个边界线
ax.axis["right"].set_visible(False)
ax.axis["top"].set_visible(False)

#左、下边界线带箭头
ax.axis["bottom"].set_axisline_style("-|>", size = 1.5)
ax.axis["left"].set_axisline_style("->", size = 1.5)
ax.xaxis.set_ticks_position('bottom')
ax.yaxis.set_ticks_position('left')
#ax.spines['bottom'].set_position(('data', 0))
#ax.spines['left'].set_position(('data', 0))

#设置刻度
ax.xaxis.set_major_locator(MultipleLocator(2))#将x主刻度标签设置为2的倍数
ax.xaxis.set_major_formatter(FormatStrFormatter('%1.1f'))#设置x轴主刻度格式
ax.xaxis.set_minor_locator(MultipleLocator(1))#将x轴次刻度标签设置为1的倍数
#ax.xaxis.set_minor_formatter(FormatStrFormatter('%1.1f'))#设置x轴次刻度格式
ax.yaxis.set_major_locator(MultipleLocator(1))#将x主刻度标签设置为2的倍数
ax.yaxis.set_major_formatter(FormatStrFormatter('%1.1f'))#设置x轴主刻度格式
ax.yaxis.set_minor_locator(MultipleLocator(0.5))#将x轴次刻度标签设置为1的倍数
#ax.yaxis.set_minor_formatter(FormatStrFormatter('%1.1f'))#设置x轴次刻度格式

#显示网格
ax.grid(True, linestyle='-.')
ax.xaxis.grid(True, which='major') #x坐标轴的网格使用主刻度
ax.yaxis.grid(True, which='minor') #y坐标轴的网格使用次刻度

#坐标范围、标注位置
plt.xlim(-6, 6)
plt.ylim(0, 9)
plt.legend(loc='best')
plt.show()
fig.savefig('2.png')
图3对应的代码:
#encoding=utf-8
import matplotlib.pyplot as plt
from mpl_toolkits.axisartist.axislines import SubplotZero
import pandas as pd
import numpy as np
from matplotlib.ticker import MultipleLocator, FormatStrFormatter

#创建画布和绘图区对象。
fig = plt.figure(1, (10, 6))
ax = SubplotZero(fig, 1, 1, 1)
fig.add_subplot(ax)

#输入因变量。
y1 = pd.read_csv('2_1.csv')
y1 = np.array(y1)
y2 = pd.read_csv('2_2.csv')
y2 = np.array(y2)
assert y1.shape[0]==y2.shape[0], '两个因变量个数不相等!'

#设置自变量的范围和个数。设置折线属性。
x = np.linspace(-5, 5, y1.shape[0])
plt.plot(x,y1,'r-',label='ours', color='red', linestyle='dashed', marker='o', markerfacecolor='blue', markersize='2')
plt.plot(x,y2,'b-',label='GT')

#隐藏绘图区的四个边界。
ax.axis[:].set_visible(False)

#添加坐标轴。
ax.axis["x1"] = ax.new_floating_axis(nth_coord=0, value=2, axis_direction="bottom")
ax.axis["x1"].toggle(all=True)#刻度和标签
ax.axis["x1"].label.set_text("time(s)")
ax.axis["x1"].label.set_color('blue')
ax.axis["x1"].set_axisline_style("-|>")

ax.axis["y1"] = ax.new_floating_axis(nth_coord=1, value=3, axis_direction="left")
ax.axis["y1"].toggle(all=True)
ax.axis["y1"].label.set_text("distance(m)")
ax.axis["y1"].label.set_color('blue')
ax.axis["y1"].set_axisline_style("->")

ax.axis["x2"] = ax.new_floating_axis(nth_coord=0, value=5, axis_direction="bottom")
ax.axis["x2"].toggle(all=False)
ax.axis["x2"].label.set_text("meanTime(s)")
ax.axis["x2"].label.set_color('blue')
ax.axis["x2"].set_axisline_style("-|>")

ax.axis["y2"] = ax.new_floating_axis(nth_coord=1, value=1, axis_direction="left")
ax.axis["y2"].toggle(all=True)
ax.axis["y2"].label.set_text("meanDistance(m)")
ax.axis["y2"].label.set_color('blue')
#ax.axis["y2"].set_axisline_style("->")

#设置刻度
ax.xaxis.set_major_locator(MultipleLocator(2))#将x主刻度标签设置为2的倍数
ax.xaxis.set_major_formatter(FormatStrFormatter('%1.1f'))#设置x轴主刻度格式
ax.xaxis.set_minor_locator(MultipleLocator(1))#将x轴次刻度标签设置为1的倍数
#ax.xaxis.set_minor_formatter(FormatStrFormatter('%1.1f'))#设置x轴次刻度格式
ax.yaxis.set_major_locator(MultipleLocator(1))#将x主刻度标签设置为2的倍数
ax.yaxis.set_major_formatter(FormatStrFormatter('%1d'))#设置x轴主刻度格式
ax.yaxis.set_minor_locator(MultipleLocator(0.5))#将x轴次刻度标签设置为1的倍数
#ax.yaxis.set_minor_formatter(FormatStrFormatter('%1.1f'))#设置x轴次刻度格式

#显示网格
ax.grid(True, linestyle='-.')
ax.xaxis.grid(True, which='major') #x坐标轴的网格使用主刻度
ax.yaxis.grid(True, which='minor') #y坐标轴的网格使用次刻度

#坐标范围、标注位置
plt.xlim(-8, 8)
plt.ylim(0, 9)
plt.legend(loc='best')
plt.show()
fig.savefig('3.png')
2_1.csv:
data
1.2
3.12
4
5.2
6.78
7.1
2_2.csv:
data
1.5
3.9
4
5.1
7.8
7.9
